Use the HPC Performance Characterization viewpoint to estimate CPU usage, memory efficiency, and floating-point utilization for compute-intensive or throughput applications. Compute-intensive or throughput applications should use hardware resources efficiently for the duration of their elapsed time. Use the HPC Performance Characterization analysis as a starting point for optimizing application performance and runtime.
To interpret the performance data provided in the HPC Performance Characterization viewpoint, you may follow the steps below:
Tip
Use the Analyzing an OpenMP* and MPI Application tutorial to review basic steps for tuning a hybrid application. The tutorial is available from the Intel Developer Zone at https://software.intel.com/en-us/itac-vtune-mpi-openmp-tutorial-lin.
1. Define a Performance Baseline
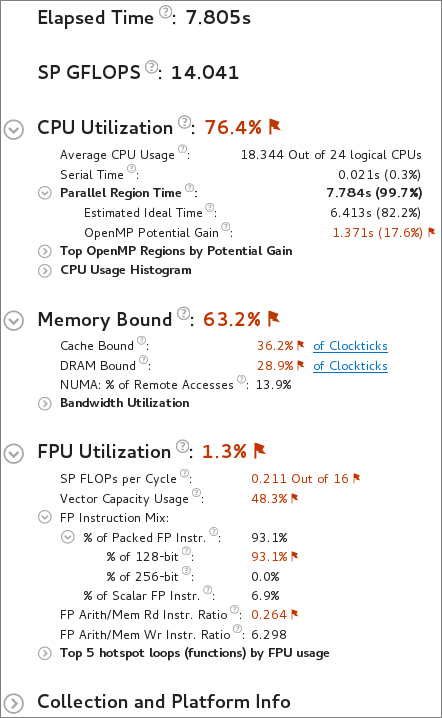
Start with exploring the Summary window that provides general information on your application execution. Key areas for optimization include the elapsed time and single precision floating-point operation per second (SP GFLOPS) counts. A double precision FLOP is represented as two single precision FLOPS throughout the analysis result. Red text indicates an area of potential optimization. Hover over a flag to learn more about how to improve your code.
Use the Elapsed Time and SP GFLOPS values as a baseline for comparison of versions before and after optimization.
2. Determine Optimization Opportunities
Review the Summary window to find the key optimization opportunities for your application. Performance metrics that can be improved are marked in red. Issues identified could include CPU Utilization, Memory Bound, FPU Utilization, or a combination of these. The following sections provide suggested next steps for each performance aspect:
CPU Utilization
Compare the serial time to the parallel region time. If the serial portion is significant, consider options to minimize serial execution, either by introducing more parallelism or by doing algorithm or microarchitecture tuning for sections that seem unavoidably serial. For high thread-count machines, serial sections have a severe negative impact on potential scaling (Amdahl's Law) and should be minimized as much as possible.
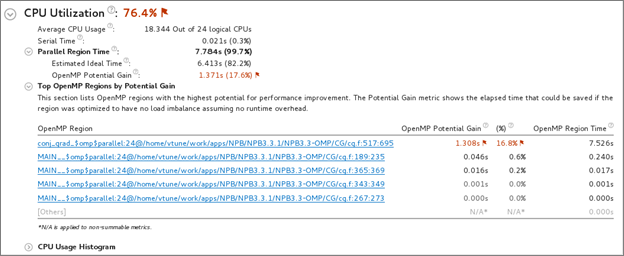
For applications with Intel OpenMP*, review the OpenMP Potential Gain to estimate the efficiency of OpenMP parallelization in the parallel part of the code. The Potential Gain metric estimates the elapsed time between the actual measurement and an idealized execution of parallel regions, assuming perfectly balanced threads and zero overhead of the OpenMP runtime on work arrangement. Use this data to understand the maximum time that you may save by improving OpenMP parallelism. If Potential Gain for a region is significant, you can go deeper and select the link on a region name to navigate to the Bottom-up window employing an OpenMP Region dominant grouping and the region of interest selection. For example, the Tasking (OpenMP) column shows how much time was spent allocating and completing OpenMP tasks. This data is used to help calculate the total potential gain. You can improve your OpenMP overhead by reducing the task granularity and therefore reducing the time spent tasking.
For MPI applications, review the MPI Imbalance metric that shows the CPU time spent by ranks spinning in waits on communication operations, normalized by number of ranks on the profiling node. The metric issue detection description generation is based on minimal MPI Busy Wait time by ranks. If the minimal MPI Busy wait time by ranks is not significant, then the rank on with the minimal time most likely lies on the critical path of application execution. In this case, review the CPU utilization metrics by this rank.

For hybrid MPI + OpenMP applications, the sub-section "MPI Rank on Critical Path" shows OpenMP efficiency metrics like Serial (outside of any OpenMP region) time and OpenMP Potential Gain. If the minimal MPI Busy Wait time is significant, it can be a result of suboptimal communication schema between ranks or imbalance triggered by another node. In this case, use Intel® Trace Analyzer and Collector for in depth analysis of communication schema.
For applications that do not use OpenMP or MPI runtime libraries, review the CPU Usage Histogram, which displays the Elapsed Time of your application, broken down by CPU utilization levels. Use the data in the Bottom-up and Top-down Tree windows to identify the most time-consuming functions in your application by CPU utilization. Focus on the functions with the largest CPU time and low CPU utilization level as your candidates for optimization (for example, parallelization).
Consider running Locks and Waits analysis when there are multiple locks used in one parallel construct to find the performance impact of a particular lock.
Memory Bound
A high Memory Bound value might indicate that a significant portion of execution time was lost while fetching data. The section shows a fraction of cycles that were lost in stalls being served in different cache hierarchy levels (L1, L2, L3) or fetching data from DRAM. For last level cache misses that lead to DRAM, it is important to distinguish if the stalls were because of a memory bandwidth limit since they can require specific optimization techniques when compared to latency bound stalls. VTune Amplifier shows a hint about identifying this issue in the DRAM Bound metric issue description. This section also offers the percentage of accesses to a remote socket compared to a local socket to see if memory stalls can be connected with NUMA issues.

For Intel® Xeon Phi™ processors formerly code named Knights Landing, there is no way to measure memory stalls to assess memory access efficiency in general. Therefore Back-end Bound stalls that include memory-related stalls as a high-level characterization metric are shown instead. The second level metrics are focused particularly on memory access efficiency. A high L2 Hit Bound or L2 Miss Bound value indicates that a high ratio of cycles were spent handing L2 hits or misses. A high DRAM Bandwidth Bound or MCDRAM Bandwidth Bound value indicates that a large percentage of the overall elapsed time was spent with high bandwidth utilization. A high DRAM Bandwidth Bound value is an opportunity to run the Memory Access analysis to identify data structures that can be allocated in high bandwidth memory (MCDRAM), if it is available.
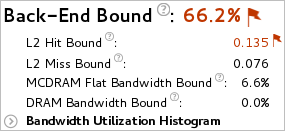
The Bandwidth Utilization Histogram shows how much time the system bandwidth was utilized by a certain value (Bandwidth Domain) and provides thresholds to categorize bandwidth utilization as High, Medium and Low. The thresholds are calculated based on benchmarks that calculate the maximum value. You can also set the threshold by moving sliders at the bottom of the histogram. The modified values are applied to all subsequent results in the project.
Switch to the Bottom-up window and review the Memory Bound columns in the grid to determine optimization opportunities.
If your application is memory bound, consider running a Memory Access analysis for deeper metrics and the ability to correlate these metrics with memory objects.
FPU Utilization
Note
FPU and GFLOPS metrics are supported on 3rd Generation Intel Core™ processors, 5th Generation Intel processors, and 6th Generation Intel processors. Limited support is available for Intel® Xeon Phi™ processors formerly code named Knights Landing. The metrics are not currently available on 4th Generation Intel processors. Expand the Details section on the analysis configuration pane to view the processor family available on your system.
The FPU Utilization metric represents how intensively your program uses floating point units and helps to assess vectorization efficiency. 100% means that your application performs maximum number of floating point operations available on your hardware platform during each cycle. For example, on 5th generation Intel® processors, the maximum number of floating point operations with single precision is 32 per cycle per core (2 FMA blocks with 8 single precision vector length per block).
Low FPU utilization numbers can be a result of one of the following issues:
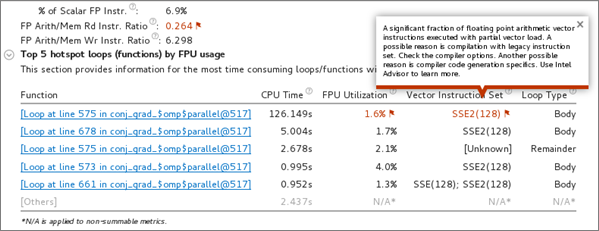
Poorly vectorized code that is either scalar or using partial vector load.
Unaligned memory access that leads to excessive memory operations.
Stalls on memory operations. For example, when the code is also bandwidth-bound.
Use second level metrics to learn the reason for low utilization connected with poor vector code generation. Relevant metrics might include:
Vector Capacity Usage
FP Instruction Mix
FP Arithmetic Instructions per Memory Read or Write
SP FLOPs per Cycle, which could indicate memory bandwidth bound code
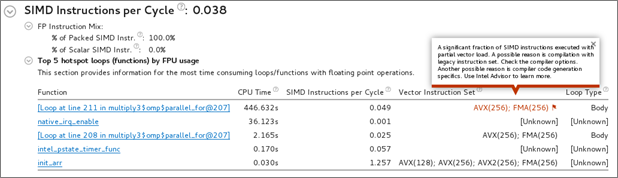
The Top Loops/Functions with FPU Usage by CPU Time table shows the top functions that contain floating point operations sorted by CPU time. The FPU Utilization column provides issue descriptions based on whether a loop/function is bandwidth bound, vector instruction set, scalar, or vector and will provide direction on fixing memory bandwidth, changing the vector instruction set, or using Intel Advisor to improve FPU utilization.
For Intel® Xeon Phi™ processors (formerly code named Knights Landing), the following FPU metrics are available instead of FLOP counters:
SIMD Instructions per Cycle
Fraction of packed SIMD instructions versus scalar SIMD Instructions per cycle
Vector instructions for loops set based on static analysis
3. Analyze Source
Double-click the function you want to optimize to view its related source code file in the Source/Assembly window. You can open the code editor directly from the Intel® VTune™ Amplifier and edit your code (for example, minimizing the number of calls to the hotspot function).
4. Explore Other Analysis Types
Run a memory access analysis to view more detail about cache bound and memory bound issues affecting the performance of your application.
Use the Intel Advisor to analyze the application for vectorization optimization.