Use MPI Performance Snapshot for a quick view into your MPI application's load imbalance, memory usage, and computation vs serial time.
MPI Performance Snapshot is a scalable lightweight performance tool for MPI applications on Linux* systems. It collects the MPI application statistics, such as communication, activity, load balance, and presents it in an easy-to-read format. Use the collected information for in-depth analysis of the application scalability and performance.
Install
MPI Performance Snapshot is available as a free product download from the Intel® Developer Zone and is also available pre-installed as part of Intel® Parallel Studio XE Cluster Edition and Intel® Trace Analyzer and Collector.
To get the free product download:
Visit http://www.intel.com/mpi-snapshot for the latest product download package.
Download and extract the mps_standalone.tgz file to your local system.
Extract the contents to a writeable location on your local system.
If you have MPI Performance Snapshot installed as part of Intel Parallel Studio Cluster Edition, no additional installation is required.
Use
Detailed instructions for using MPI Performance Snapshot and interpreting the results are available in the MPI Performance Snapshot User's Guide.
Compile your program using compiler wrappers from your MPI implementation.
Set up environment variables to run MPI Performance Snapshot. Run the mpsvars.sh script to set the appropriate environment variables. Use the -w option if you plan to collect hardware metrics.
Run your application with your MPI implementation.
For Intel MPI Library: Run your application with the -mps option. For example:
$ mpirun -mps -n N ./myApp
This example creates a directory called stat_<date>-<time> and a file called stat-N.bin where N is the process number. Each rank creates a separate file. If you collect hardware metrics, the _mps_<date>-<time> directory is also created.
For other MPI implementations: Run your application with the mpsrun.sh script. For example:
$ mpirun -n N mpsrun.sh ./myApp
This example creates a directory called stat_<date> and a file called stat-N.bin where N is the process number. Each rank creates a separate file. If you collect hardware metrics, the _mps_<date> directory is also created.
Tip
The mpsrun.sh script only uses date for MPS_STAT_DIR_POSTFIX rather than date and time because the time is different for different processes. You can change the directory name generation by modifying mpsrun.sh.
Review the collected data by running MPI Performance Snapshot in the command line. Provide the result with the directory name, a file name (for example, stat-12.bin) and MPI Performance Snapshot will find all files in the appropriate format in the same directory, or with a period (.) and MPI Performance Snapshot will look for all stat-N.bin files on the system. The examples below all point to a specific directory name.
To get MPI function times:
$ mps -t stat_DATE-TIME _mps_DATE-TIME
To get the communication pattern:
$ mps -c stat_DATE-TIME _mps_DATE-TIME
To get details:
$ mps -t -D stat_DATE-TIME _mps_DATE-TIME
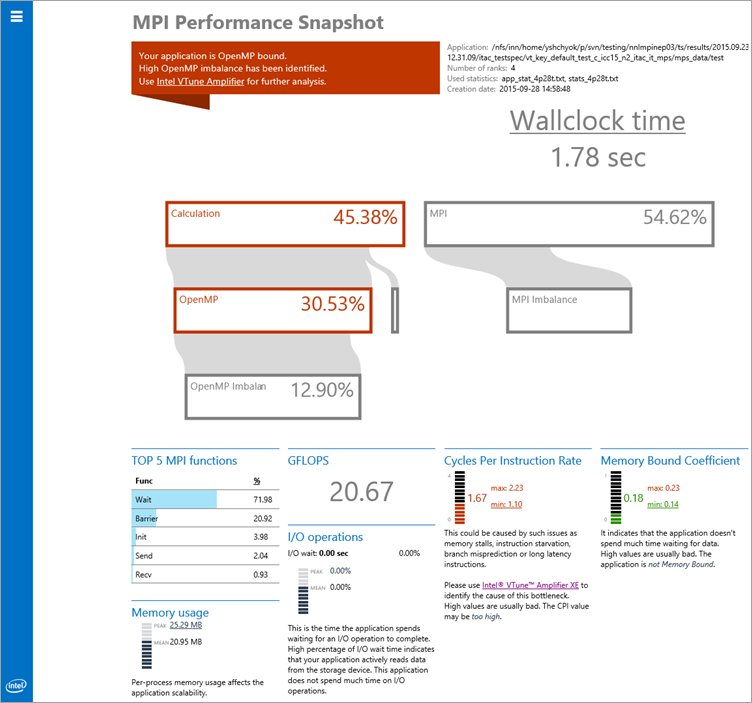
Generate the HTML summary report (mps_report.html) and analyze the data. For example:
$ mps -s -g stat_<DATE-TIME> _mps_<DATE-TIME>
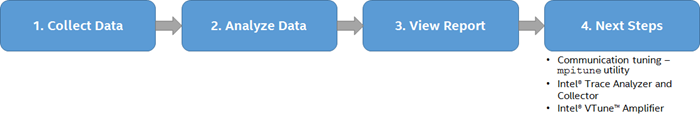
Determine appropriate next steps based on result analysis. Common next steps may include communication tuning with the mpitune utility or using another performance analysis tool for more detailed information, such as Intel Trace Analyzer and Collector or Intel VTune Amplifier. A detailed tutorial is available from https://software.intel.com/en-us/itac-vtune-mpi-openmp-tutorial-lin.
Requirements and Limitations
Recommended compilers: Intel® C/C++ or Fortran Compiler (other compilers can be used, but information about OpenMP* regions is only available from the Intel OpenMP library)
Intel® MPI library version 2017 or later. Other MPICH-based MPI implementations can be used, but information about internal MPI imbalance is only available from the Intel MPI library. There is no support for OpenMPI.
MPI Performance Snapshot only works with applications dynamically linked with MPI.
Hardware metrics are collected via Application Performance Snapshot. Restrictions apply.