Note
This type of analysis is supported only with the Intel® VTune™ Amplifier for Systems.
If you configured your collection to monitor IRQ Ftrace* events either by using the System Overview analysis type or custom analysis, the Intel® VTune™ Amplifier analyzes code performance inside IRQs and displays interrupts statistics in the default Hardware Events viewpoint. Follow the steps below to analyze the collected interrupt data:
Identify Critical Interrupt Handlers
Start your analysis with the Summary window that provides overall interrupt handlers statistics in the following sections:
Top Interrupt Handlers that shows the most active interrupt handlers sorted by Interrupt Time.
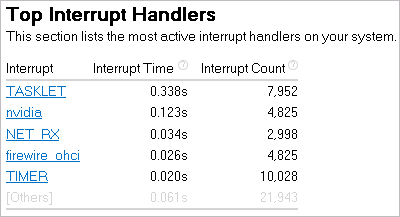
Clicking an interrupt handler in the list opens the grid view grouped by Interrupt/Interrupt Duration Type/Function/Call Stack level.
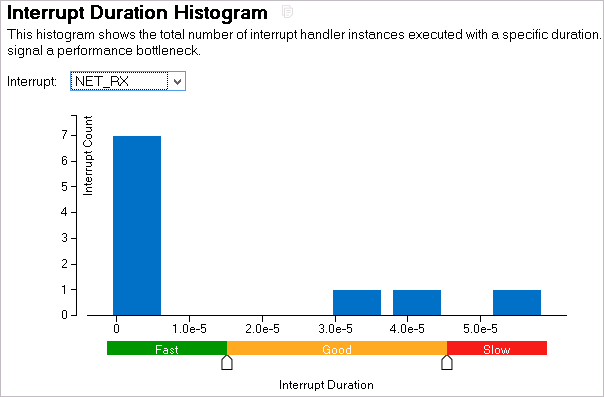
Interrupt Duration Histogram that shows a distribution of interrupt handler instances per duration types defined by the VTune Amplifier. High number of slow instances may signal a performance bottleneck. Use the drop-down menu to view data for different interrupt handlers.
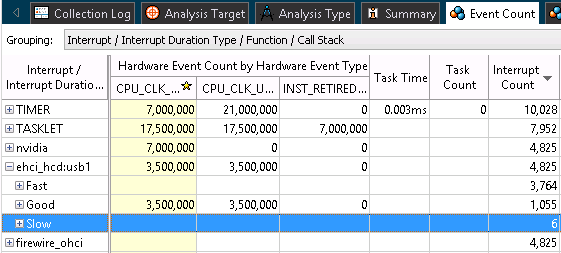
When you identified a slow interrupt in the Summary window, you may switch to the grid view sorted by the Interrupt/.. level, locate this interrupt, expand the hierarchy to view a function where slow interrupts occurred, and double-click the function to explore its source code in the Source view.
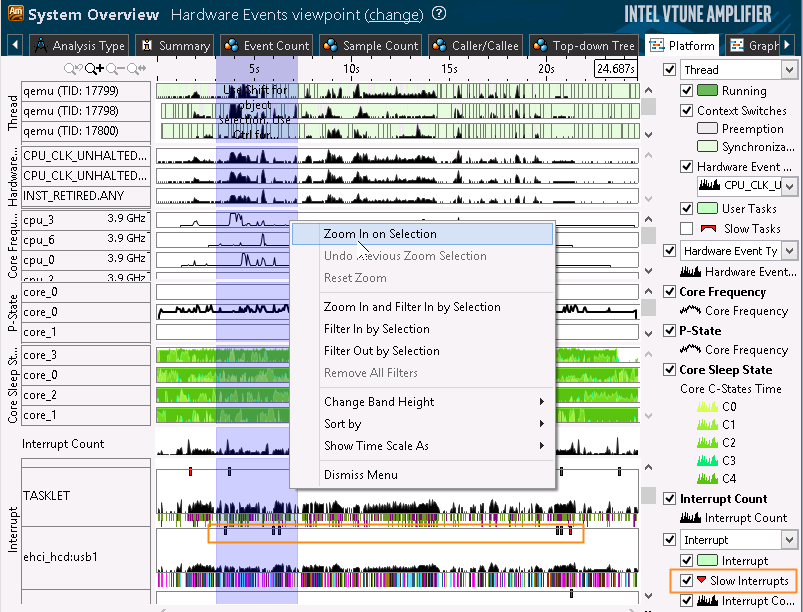
Analyze Slow Interrupts on the Timeline
Switch to the Platform tab to analyze CPU utilization, GPU usage and power consumption during your code execution and correlate this data with the time frames when slow interrupts occurred. You may enable the Slow Interrupts markers on the timeline, select a time frame with slow interrupts and zoom in to the selected region for detailed analysis: