Intel® VTune™ Amplifier introduces a frames analysis, which is especially useful for exploring the long latency activity. You may use the Frame API to mark the start and finish of the code regions executed repeatedly (frames) in such applications as simulators with a time step loop, computations with a convergence loop, game applications computing next graphics frame, and so on. VTune Amplifier analyzes the marked code regions and identifies bottlenecks in your application caused by slow or fast frame rate. To interpret the performance data provided during the frames analysis, you may follow the steps below:
Analyze Summary Frames Statistics
Click the Summary tab to open the Summary window and analyze the Frames Rate Histogram. Hover over a bar to see the total number of frames in your application executed with a specific frame rate. High number of slow or fast frames signals a performance bottleneck.

VTune Amplifier automatically sets up thresholds for slow and fast frame rate. But you may change them, if needed, by dragging the slider at the bottom of the histogram. The thresholds you set will be automatically applied to all subsequent results for this project.
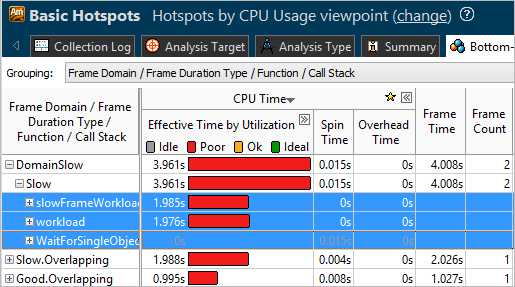
Switch to the Bottom-up window and group the data in the grid by Frame Domain/Frame Duration Type/Function/Call Stack:

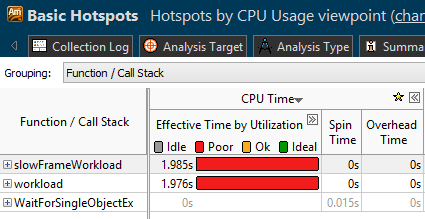
This grouping displays frame analysis metrics including the Frame Time that is the wall time during which frames were active. Focus on the frames with the highest Frame Time values. Expand a frame domain node to see frames grouped by frame duration. You may select slow frames, right-click and select Filter In by Selection to filter out all the data other than slow frames in this domain. Then you may group the data back by Function/Call Stack to see the functions that took most of the time in these slow frames:

Analyze the Timeline
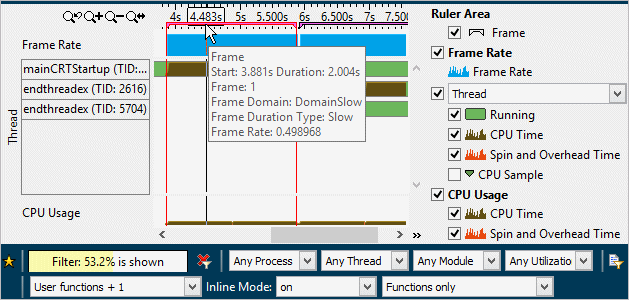
In the Bottom-up window, analyze the frame data represented in the Timeline pane. If you filtered the grid by slow frames, the Timeline data is also automatically filtered to display data for the selected frames:

The Ruler Area displays frame markers. Hovering over a marker opens a tooltip with details on frame duration, frame rate and so on.
The Frame Rate band displays how the frame rate is changing over time. To understand the cause of the bottleneck, identify sections with the Slow or Fast frame types and analyze the CPU Usage and Thread Concurrency data. For example, you may detect the Slow frame rate for the section with the poor CPU usage or thread contention. In this case, you may parallelize the code to utilize CPU resources more effectively or optimize the thread management.
To identify a hotspot function containing the critical frame from the Timeline view, select the range with the Slow or Fast frame rate. VTune Amplifier highlights the selected frame in the Bottom-up grid.
Identify the Hotspot Code Sections
Double-click a critical function executing a slow/fast frame to view its source code. By default, the VTune Amplifier highlights the code line in this function that took the most CPU time to execute.