After you run the Suitability
 and
Dependencies
and
Dependencies
 tools,
click the
Summary button to display the
Summary window to view a concise summary of each
site's predicted performance (Suitability) information and data sharing
(Dependencies) problems. It also displays a summary of the profile information
collected by the Survey tool.
tools,
click the
Summary button to display the
Summary window to view a concise summary of each
site's predicted performance (Suitability) information and data sharing
(Dependencies) problems. It also displays a summary of the profile information
collected by the Survey tool.
|
|
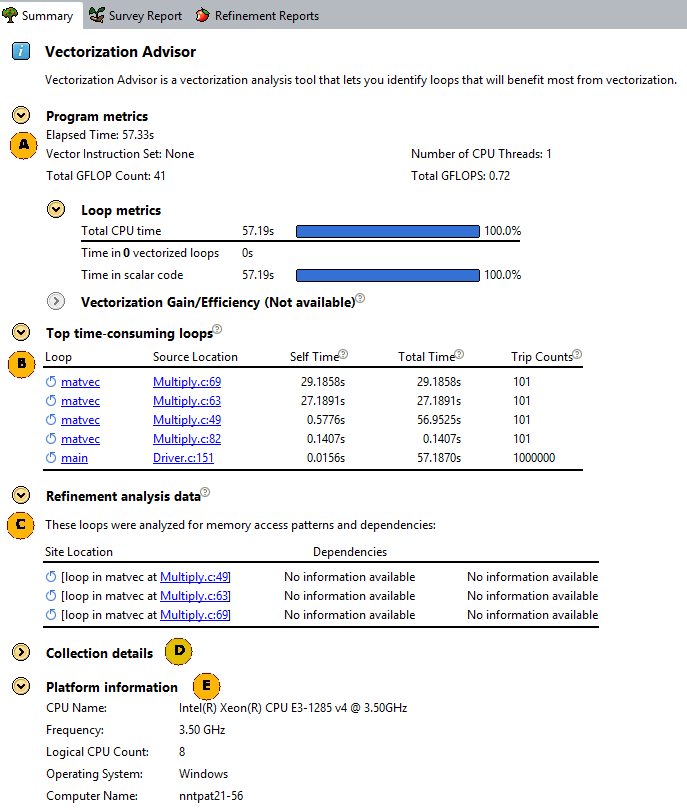
The Program metrics section comprises execution time statistics, vector instruction set, number of CPU Threads utilized. The section also covers loop metrics such as CPU time and loop execution information. You can find the vectorization efficiency data in this section as well. |
|
|
The Top time-consuming loops section summarizes the loop names, loop source locations, and execution time statistics. |
|
|
The Dependencies Problems column summarizes the predicted data sharing problems collected by the Dependencies tool. To display the Dependencies Report window at the corresponding parallel site location, double-click a number under this column. The Strides Distribution column reports the memory access stride distribution within the loop in the ratio format in %: unit strides, constant strides, and variable strides. |
|
|
The Collection details section shows execution statistics for each of the collectors, as well as the Collection Log and Application Output links that lead to the corresponding report logs and output details. |
|
|
The Platform Information section reports the system information including software and hardware summary of your system. |


