Contents
Vectorization Advisor
Threading Advisor
Intel Advisor
Vectorization Advisor is a vectorization optimization tool that lets you identify loops that will benefit most from vectorization, identify what is blocking effective vectorization, explore the benefit of alternative data reorganizations, and increase the confidence that vectorization is safe.
Threading Advisor is a threading design and prototyping tool that lets you analyze, design, tune, and check threading design options without disrupting your normal development.
Intel® Parallel Studio XE Professional Edition
Intel® Parallel Studio XE Cluster Edition
If you do not already have access to the Intel® Advisor, download an evaluation copy from http://software.intel.com/en-us/articles/intel-software-evaluation-center/. (Use Version 15.0 or higher of an Intel compiler to get more benefit from the Vectorization Advisor Survey Report; download an evaluation copy from http://software.intel.com/en-us/articles/intel-software-evaluation-center/.)
Where vectorization will pay off the most
If vectorized loops are providing benefit, and if not, why not
Un-vectorized and under-vectorized loops, and the estimated expected performance gain of vectorization or better vectorization
How data accessed by vectorized loops is organized and the estimated expected performance gain of reorganization
Trip Counts analysis - Dynamically identifies the number of times loops are invoked and execute (sometimes called call count/loop count and iteration count respectively). Use this added information in the Survey Report to make better decisions about your vectorization strategy for particular loops, as well as optimize already-parallel loops.
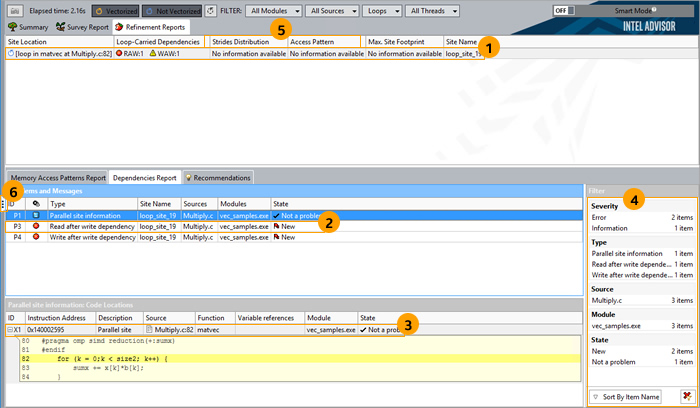
Dependencies Report - For safety purposes, the compiler is often conservative when assuming data dependencies. Use a Dependencies-focused Refinement Report to check for real data dependencies in loops the compiler did not vectorize because of assumed dependencies. If real dependencies are detected, the analysis can provide additional details to help resolve the dependencies. Your objective: Identify and better characterize real data dependencies that could make forced vectorization unsafe.
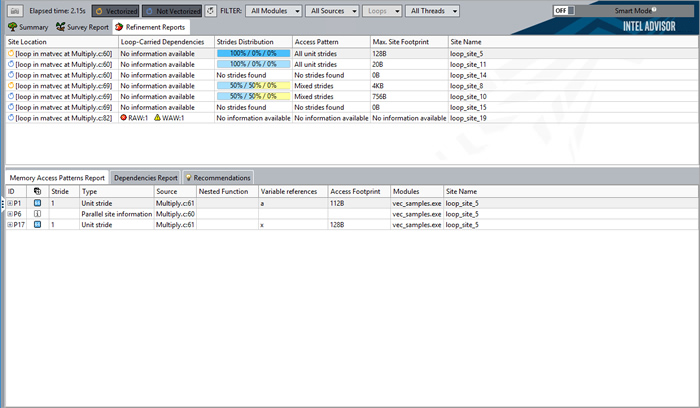
Memory Access Patterns (MAP) Report - Use a MAP-focused Refinement Report to check for various memory issues, such as non-contiguous memory accesses and unit stride vs. non-unit stride accesses. Your objective: Eliminate issues that could lead to significant vector code execution slowdown or block automatic vectorization by the compiler.
To Do This |
Optimal C/C++ Settings |
|---|---|
Request full debug information (compiler and linker). |
-g |
Request moderate optimization. |
-O2 or higher |
Produce compiler diagnostics (necessary for version 15.0 of the Intel compiler; unnecessary for version 16.0 and higher). |
-qopt-report=5 |
Enable vectorization |
-vec |
Enable SIMD directives |
-simd |
Enable generation of multi-threaded code based on OpenMP* directives. |
-qopenmp |
To Do This |
Optimal Fortran Settings |
|---|---|
Request full debug information (compiler and linker). |
-g |
Request moderate optimization. |
-O2 or higher |
Produce compiler diagnostics (necessary for version 15.0 of the Intel compiler; unnecessary for version 16.0 and higher). |
-qopt-report=5 |
Enable vectorization |
-vec |
Enable SIMD directives |
-simd |
Enable generation of multi-threaded code based on OpenMP* directives. |
-qopenmp |
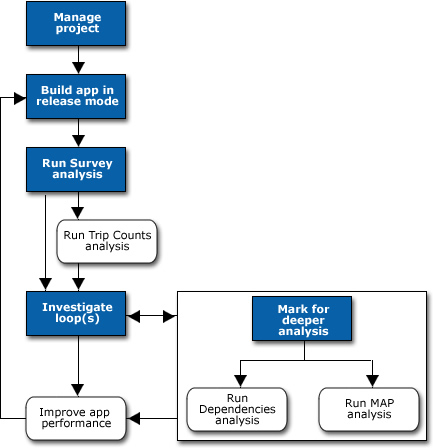
Follow these steps (white blocks are optional) to get started using
the
Vectorization Advisor
in the
Intel Advisor.
Choose File > New > Project… (or click New Project… in the Welcome page) to open the Create a Project dialog box.
Supply a name and location for your project, then click the Create Project button to open the Project Properties dialog box.
On the left side of the Analysis Target tab, ensure the Survey Hotspots Analysis type is selected.
Set the appropriate parameters. (Setting the binary/symbol search and source search directories is optional for the Vectorization Advisor.)
Click the OK button to close the Project Properties dialog box.
If you plan to run other vectorization Analysis Types, set parameters for them now, if possible.
If possible, use the Inherit settings from Survey Hotspots Analysis Type checkbox for other Analysis Types.
The Survey Trip Counts Analysis type has similar parameters to the Survey Hotspots Analysis type.
The Dependencies Analysis and Memory Access Patterns Analysis types consume more resources than the Survey Hotspots Analysis type. If these Refinement analyses take too long, consider decreasing the workload.
Select Track stack variables in the Dependencies Analysis type to detect all possible dependencies.
When necessary, click the tab at the top of the Workflow pane to switch between the Vectorization Workflow and Threading Workflow.
Under
Survey Target in the
Vectorization Workflow, click the
 control to collect Survey data while your application
executes.
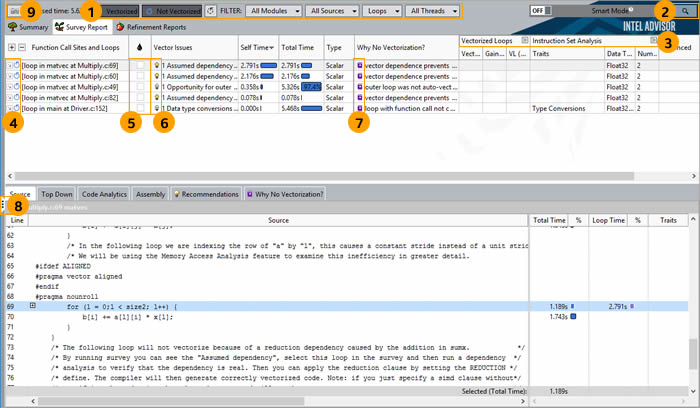
After the Intel Advisor collects the data, it displays a Survey Report similar to the following:
1 |
Click the various Filter controls (buttons and drop-down lists) to temporarily limit displayed data based on your criteria. |
2 |
Click the Search control to search for specific data. |
3 |
Click the Expand/Collapse controls to show/hide sets of columns. |
4 |
Click a loop data row in the top of the Survey Report to display more data specific to that loop in the bottom of the Survey Report. Double-click a loop data row to display a Survey Source window. |
5 |
Click a checkbox to mark a loop for deeper analysis. |
6 |
If present, click the
|
7 |
If present, click the
|
8 |
Click the control to show/hide the Workflow pane. |
9 |
Click the control to save a result snapshot you can view any time. |
This step is optional.
Before running a Trip Counts analysis, make sure you set the appropriate Project Properties for the Survey Trip Counts Analysis type. (Use the same application, but a smaller input data set if possible.)
Under
Find Trip Counts in the
Vectorization Workflow, click the
 control to collect Trip Counts data while your
application executes.
After the Intel Advisor collects the data, it adds a Trip Counts column set to the Survey Report. Median data is shown by default. Min, Max, Call Count, and Iteration Duration data are shown when the column set is expanded.
Key information from the Intel compiler vectorization and optimization reports
Source and assembly code for the data row selected at the top of the report
Code-specific how-can-I-fix-this-issue? Recommendations and Compiler Diagnostic Details for the data row selected at the top of the report
Pay particular attention to the hottest loops in terms of Self Time and Total Time. Optimizing these loops provides the most benefit. Innermost loops and loops near innermost loops are often good candidates for vectorization. Outermost loops with significant Total Time are often good candidates for parallelization with threads.
Check if the best possible Vector ISA is used by your application, or if there are heavy operations required for vectorization that might be a problem, such as masking or gather operations.
Compare the modeled Gain Estimate with the gain expected from the Vector Instruction Set to ensure you are likely to get the optimal speed-up. For example: AVX2 processing of 32-bit integers should give an 8x performance gain. If the Gain Estimate is much lower than the expected gain for the Vector ISA, consider optimizing an already vectorized loop by eliminating heavy vector operations, aligning data, or rewriting the loop to remove control-flow clauses.
A vectorized loop may not achieve the best performance when the compiler peels a source loop into peeled and remainder loops. If the peeled or remainder loop takes a significant portion of loop execution time, aligning data or changing the number of loop iterations may help.
This step is optional.
Set the appropriate Project Properties for the Dependencies Analysis type. (Use the same application, but a smaller input data set if possible. And select Track stack variables to detect all possible dependencies.)
Mark one or more un-vectorized loops for deeper analysis in the Survey Report.
Under
Check Dependences in the
Vectorization Workflow, click the
 control to collect Dependencies data while your
application executes.
After the Intel Advisor collects the data, it displays a Dependencies-focused Refinement Report similar to the following:
#pragma simd ICL/ICC/ICPC directive, or #pragma omp simd OpenMP* 4.0 standard, or !DIR$ SIMD or !$OMP SIMD IFORT directive to ignore all dependencies in the loop
#pragma ivdep ICL/ICC/ICPC directive or !DIR$ IVDEP IFORT directive to ignore only vector dependencies (which is safest, but less powerful in certain cases)
restrict keyword
If there is an anti-dependency (often called a Write after read dependency or WAR), enable vectorization using the #pragma simd vectorlength(k) ICL/ICC/ICPC directive or !DIR$ SIMD VECTORLENGTH(k) IFORT directive, where k is smaller than the distance between dependent items in anti-dependency:
If there is a reduction in the loop, enable vectorization using the #pragma omp simd reduction(operator:list) ICL/ICC/ICPC directive or !$OMP SIMD REDUCTION(operator:list) IFORT directive.
Rewrite code to remove dependencies.
This step is optional.
Set the appropriate Project Properties for the Memory Access Patterns Analysis type. (Use the same application, but a smaller input data set if possible.)
Mark one or more loops for deeper analysis in the Survey Report.
Under
Check Memory Access Patterns in the
Vectorization Workflow, click the
 control to collect MAP data while your application
executes.
After the Intel Advisor collects the data, it displays a MAP-focused Refinement Report similar to the following:
To Do This |
Optimal C/C++ Settings |
|---|---|
Retrieve better compiler diagnostics. |
Disable Interprocedural Optimization (IPO): -no-ipo |
Address any issues with source line matching. |
|
Looks like your application doesn't use fresh vector instructions? Experiment with generating code for different instructions. |
-xHost, -xSSE4.2, -xAVX, -axAVX, -xCORE-AVX2, -axCORE-AVX2, -xCOMMON-AVX512, -xMIC-AVX512, -axMIC-AVX512, -xCORE-AVX512 |
To Do This |
Optimal Fortran Settings |
Retrieve better compiler diagnostics. |
Disable Interprocedural Optimization (IPO): -no-ipo |
Address any issues with source line matching. |
|
Looks like your application doesn't use fresh vector instructions? Experiment with generating code for different instructions. |
-xHost, -xSSE4.2, -xAVX, -axAVX, -xCORE-AVX2, -axCORE-AVX2, -xCOMMON-AVX512, -xMIC-AVX512, -axMIC-AVX512, -xCORE-AVX512 |
Survey Report - Shows the loops and functions where your application spends the most time. Use this information to discover candidates for parallelization with threads.
Trip Counts analysis - Shows the minimum, maximum, and median number of times a loop body will execute, as well as the number of times a loop is invoked. Use this information to make better decisions about your threading strategy for particular loops.
Annotations - Insert to mark places in your application that are good candidates for later replacement with parallel framework code that enables threading parallel execution. Annotations are subroutine calls or macros (depending on the programming language) that can be processed by your current compiler but do not change the computations of your application.
Suitability Report - Predicts the maximum speed-up of your application based on the inserted annotations and a variety of what-if modeling parameters with which you can experiment. Use this information to choose the best candidates for parallelization with threads.
Dependencies Report - Predicts parallel data sharing problems based on the inserted annotations. Use this information to fix the data sharing problems if the predicted maximum speed-up benefit justifies the effort.
To build applications that produce the most accurate and complete Threading Advisor analysis results, build an optimized binary of your application in release mode using these settings:
To Do This |
Optimal C/C++ Settings |
|---|---|
Search additional directory related to Intel Advisor annotation definitions. |
-I${ADVISOR_XE_[product_year]_DIR}/include |
Request full debug information (compiler and linker). |
-g |
Request moderate optimization. |
-O2 or higher |
Search for unresolved references in multithreaded, dynamically linked libraries. |
-Bdynamic |
Enable dynamic loading. |
-ldl |
To Do This |
Optimal Fortran Settings |
|---|---|
Search additional directory related to Intel Advisor annotation definitions. |
|
Request full debug information (compiler and linker). |
-g |
Request moderate optimization. |
-O2 or higher |
Search for unresolved references in multithreaded, dynamically linked libraries. |
-shared-intel |
Enable dynamic loading. |
-ldl |
Follow these steps (white blocks are optional) to get started using
the
Threading Advisor
in the
Intel Advisor.
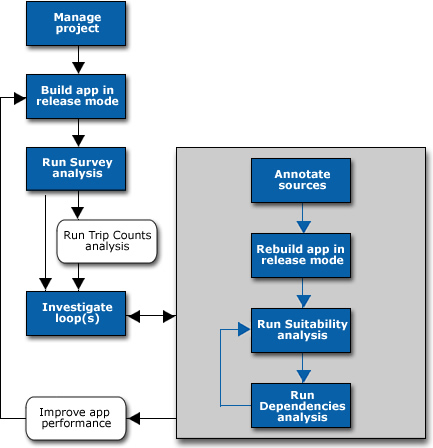
Choose File > New > Project… (or click New Project… in the Welcome page) to open the Create a Project dialog box.
Supply a name and location for your project, then click the Create Project button to open the Project Properties dialog box.
On the left side of the Analysis Target tab, ensure the Survey Hotspots Analysis type is selected.
Set the appropriate parameters, and binary/symbol search and source search directories.
Click the OK button to close the Project Properties dialog box.
If you plan to run other threading Analysis Types, set parameters for them now, if possible.
If possible, use the Inherit settings from Survey Hotspots Analysis Type checkbox for other Analysis Types.
The Survey Trip Counts Analysis type has similar parameters to the Survey Hotspots Analysis type.
The Dependencies Analysis type consume more resources than the Survey Hotspots Analysis type. If Dependencies analysis take too long, consider decreasing the workload.
When necessary, click the tab at the top of the Workflow pane to switch between the Vectorization Workflow and Threading Workflow.
Under
Survey Target in the
Threading Workflow, click the
 control to collect Survey data while your application
executes. Use the resulting information to discover candidates for
parallelization with threads.
This step is optional.
Before running a Trip Counts analysis, make sure you set the appropriate Project Properties for the Survey Trip Counts Analysis type.
Under
Find Trip Counts in the
Threading Workflow, click the
 control to collect Trip Counts data while your
application executes. Use the resulting information to make better decisions
about your threading strategy for particular loops.
Pay particular attention to the hottest loops in terms of Self Time and Total Time. Optimizing these loops provides the most benefit. Outermost loops with significant Total Time are often good candidates for parallelization with threads. Innermost loops and loops near innermost loops are often good candidates for vectorization.
Insert annotations to mark places in parts of your application that are good candidates for later replacement with parallel framework code that enables parallel execution. After inserting annotations, rebuild your application in release mode.
A parallel site. A parallel site is a region of code that contains one or more tasks that may execute in one or more parallel threads to distribute work. An effective parallel site typically contains a hotspot that consumes application execution time. To distribute these frequently executed instructions to different tasks that can run at the same time, the best parallel site is not usually located at the hotspot, but higher in the call tree.
One or more parallel tasks within a parallel site. A task is a portion of time-consuming code with data that can be executed in one or more parallel threads to distribute work.
Locking synchronization, where mutual exclusion of data access must occur in the parallel application.
Annotation Code Snippet |
Purpose |
|---|---|
Iteration Loop, Single Task |
Create a simple loop structure, where the task code includes the entire loop body. This common task structure is useful when only a single task is needed within a parallel site. |
Loop, One or More Tasks |
Create loops where the task code does not include all of the loop body, or complex loops or code that requires specific task begin-end boundaries, including multiple task end annotations. This structure is also useful when multiple tasks are needed within a parallel site. |
Function, One or More Tasks |
Create code that calls multiple tasks within a parallel site. |
Pause/Resume Collection |
Temporarily pause data collection and later resume it, so you can skip uninteresting parts of application execution to minimize collected data and speed up analysis of large applications. Add these annotations outside a parallel site. |
Build Settings |
Set build (compiler and linker) settings specific to the language in use. |
Before running a Suitability analysis, make sure you set the appropriate Project Properties for the Suitability Analysis type.
Under
Check Suitability in the
Threading Workflow, click the
 control to collect Suitability data while your
application executes.
Different hardware configurations and parallel frameworks
Different trip counts and instance durations
Any plans to address parallel overhead, lock contention, or task chunking when you implement your parallel framework code
Use the resulting information to choose the best candidates for parallelization with threads.
Before running a Dependencies analysis, make sure you set the appropriate Project Properties for the Dependencies Analysis type. (Use the same application, but a smaller input data set if possible.)
Under
Check Dependencies in the
Threading Workflow, click the
 control to collect Dependencies data while your
application executes. Use the resulting information to fix the data sharing
problems if the predicted maximum speed-up benefit justifies the effort.
This step is optional.
Complete developer/architect design and code reviews about the proposed parallel changes.
Choose one parallel programming framework (threading model) for your application, such as Intel® Threading Building Blocks (Intel® TBB), OpenMP*, Intel® Cilk™ Plus, or some other parallel framework.
Add the parallel framework to your build environment.
Add parallel framework code to synchronize access to the shared data resources, such as Intel TBB or OpenMP* locks or Intel Cilk Plus reducers.
Add parallel framework code to create parallel tasks.
As you add the appropriate parallel code from the chosen parallel framework during steps 4 and 5, you can keep, comment out, or replace the Intel Advisor annotations.
You can use the Intel Advisor command line interface, advixe-cl, to run analyses and reports. This makes it possible to automate many tasks as well as analyze an application running on remote hosts. You can then view results using the Intel Advisor GUI or command line reports.
To Do This |
Use This Command Line Model |
|---|---|
View a full list of command line options. (Applies to Vectorization Advisor & Threading Advisor.) |
advixe-cl -help |
Run a Survey analysis. (Applies to Vectorization Advisor & Threading Advisor.) |
advixe-cl -collect survey –project-dir ./myAdvisorProj -- myTargetApplication |
Run a Trip Counts analysis. (Applies to Vectorization Advisor & Threading Advisor.) |
advixe-cl -collect tripcounts –project-dir ./myAdvisorProj -- myTargetApplication |
Print a Survey Report to identify loop IDs for Refinement analyses. (Applies to Vectorization Advisor.) |
advixe-cl -report survey –project-dir ./myAdvisorProj |
Run a Refinement analysis. (Applies to Vectorization Advisor.) |
advixe-cl -collect [dependencies | map] -mark-up-list=[loopID],[loopID] –project-dir ./myAdvisorProj -- myTargetApplication |
Run a Dependencies analysis. (Applies to Threading Advisor.) |
advixe-cl -collect dependencies -project-dir ./myAdvisorProj -- myTargetApplicaton |
Report a top-down functions list instead of a loop list. (Applies to Vectorization Advisor & Threading Advisor.) |
advixe-cl -report survey -top-down -display-callstack |
Report all compiler opt-report and vec-report metrics. (Applies to Vectorization Advisor.) |
advixe-cl -report survey -show-all-columns |
Report the top five self-time hotspots that were not vectorized because of a not inner loop msg id. (Applies to Vectorization Advisor.) |
advixe-cl -report survey -limit 5 -filter "Vectorization Message(s)"="loop was not vectorized: not inner loop" |
If you have an Intel Advisor GUI in your cluster environment, open a result in the GUI.
If you do not have an Intel Advisor GUI on your cluster node, copy the result directory to another machine with the Intel Advisor GUI and open the result there.
Use the Intel Advisor command line reports to browse results on a cluster node.
Use mpirun, mpiexec, or your preferred MPI batch job manager with the advixe-cl command to start an analysis. You may also use the -gtool option of mpirun. See the Intel® MPI Library Reference Manual (available in the Intel® Software Documentation Library) for more information.
To Do This |
Use This Command Line Model |
|---|---|
Run 10 MPI ranks (processes), and start an Intel Advisor analysis on each rank. |
$ mpirun -n 10 advixe-cl -collect survey --project-dir ./my_proj ./your_app Intel Advisor creates a number of result directories in the current directory, named as rank.0, rank.1, ... rank.n, where n is the MPI process rank. Intel Advisor does not combine results from different ranks, so you must explore each rank result independently. |
Run 10 MPI ranks, and start an Intel Advisor analysis only on rank #1. |
$ mpirun -n 1 advixe-cl -collect survey --project-dir ./my_proj ./your_app : -np 9 ./your_app |
Document/Resource |
Description |
|---|---|
Online training is an excellent resource for novice, intermediate, and advanced users. It includes links to videos, guides, featured topics, event recaps and archived webinars, upcoming events and webinars, and more. |
|
Contain up-to-date information about the Intel Advisor, including a description, technical support, and known limitations. This document also contains system requirements, installation instructions, and instructions for setting up the command-line environment. This document is installed at <advisor-install-dir>/documentation/<locale>/<release_notes>.pdf. Check Intel Advisor Release Notes online for updates. |
|
Intel Advisor Samples, ReadMe's, and Tutorials |
Sample applications can help you learn to use the Intel Advisor. Sample applications are installed as individual compressed files under <advisor-install-dir>/samples/en/. After you copy a sample application compressed file to a writable directory, use a suitable tool to extract the contents. Extracted contents include a short README that describes how to build the sample and fix issues. Vectorization Advisor tutorials show you how to use C++ sample applications to:
A list of available tutorials is installed at <advisor-install-dir>/documentation/<locale>/tutorials/index.htm. Check Samples, ReadMe's, and Tutorials online for updates or Tutorials online for updates. |
The Help is the primary documentation for the Intel Advisor. It is also accessible from the product Help menu. This document is installed at <advisor-install-dir>/documentation/<locale>/help/index.htm. Check Intel Advisor Help online for updates. |
|
More Local Resources |
One of the key Vectorization Advisor features is a Survey Report that offers integrated compiler reports and performance data all in one place, including GUI-embedded advice on how to fix vectorization issues specific to your code. To help you quickly locate information that augments that
GUI-embedded advice, the
Intel Advisor
provides Intel compiler
mini-guides:
You can also find complete C++ Recommendations, Fortran Recommendations, and C++/Fortran Compiler Diagnostic Details advice libraries in the same location as the mini-guides. Each issue and recommendation in these HTML files is collapsible/expandable. These documents are installed below <advisor-install-dir>/documentation/<locale>/advice/. |
Web Resources |
Vectorization Advisor Glossary Vectorization Resources for Intel® Advisor Users Intel® Learning Lab (white papers, articles and more) |