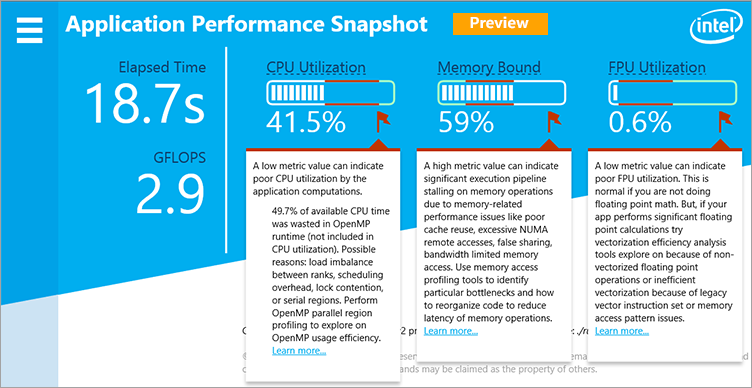
Use Application Performance Snapshot for a quick view into an application's use of available hardware (CPU, FPU, and Memory).
Note
This is a PREVIEW FEATURE. A preview feature may or may not appear in a future production release. It is available for your use in the hopes that you will provide feedback on its usefulness and help determine its future. Data collected with a preview feature is not guaranteed to be backward compatible with future releases. Please send your feedback to Intel-Performance-Snapshot-Feedback@intel.com.
Application Performance Snapshot analyzes your application's CPU and FPU usage and memory access stalls on either Windows* or Linux* systems. After analysis, it displays basic performance enhancement opportunities for systems using Intel® platforms. Use this tool as a first step in application performance analysis to get a simple snapshot of key optimization areas. To analyze MPI applications, see MPI Performance Snapshot Quick Start.

Review the following sections to get started with Application Performance Snapshot:
- Install: Download instructions for the latest version of Application Performance Snapshot
- Use: Basic workflow for using Application Performance Snapshot, from basic setup to interpreting the collected data.
- Metrics: Overview of metrics collected by Application Performance Snapshot.
Install
Application Performance Snapshot is available as a free product download from the Intel® Developer Zone and is also available pre-installed as part of Intel® Parallel Studio, Intel® System Studio, and Intel® VTune™ Amplifier XE.
To get the free product download:
- Visit http://www.intel.com/application-snapshot for the latest product download package.
- Download the installation .tgz (Linux*)/.zip (Windows*) file to your local system.
- Extract the contents to a writeable location on your local system.
Use

Run the analysis on the target application.
On Linux* (kernel version 2.6.32 or later required)
- Open a command prompt.
Set the appropriate environment variables to run the tool.
Pre-installed with VTune Amplifier: Run <install-dir>/amplxe-vars.sh, where <install-dir> is the location where Intel® VTune™ Amplifier is installed.
Example for Intel VTune Amplifier XE 2017:
>source /opt/intel/vtune_amplifier_xe_2017/amplxe-vars.shExample for Intel VTune Amplifier 2017 for Systems:
>source /opt/intel/system_studio_2017/vtune_amplifier_for_systems/amplxe-vars.sh- Downloaded from the Intel Developer Zone: Add the path for the directory to which you extracted the tool to the command line session environment: export PATH=$PATH:<install-dir>.
Run aps.sh <my app> <app parameters> where <my app> is the location of your application and <app parameters> are the parameters used to run the application.
Application Performance Snapshot launches the application and runs the analysis.
On Windows*
- Open a command prompt.
Set the appropriate environment variables to run the tool.
Pre-installed with VTune Amplifier: Run <install-dir>\amplxe-vars.bat, where <install-dir> is the location where Intel® VTune™ Amplifier is installed.
Example for Intel VTune Amplifier XE 2017:
>"C:\Program Files (x86)\IntelSWTools\VTune Amplifier XE 2017\amplxe-vars.bat"Example for Intel VTune Amplifier 2017 for Systems:
>"C:\Program Files (x86)\IntelSWTools\system_studio_2017\VTune Amplifier for Systems\amplxe-vars.bat"- Downloaded from the Intel Developer Zone: Add the path for the directory to which you extracted the tool to the command line session environment: set PATH=%PATH%;<install-dir>.
Run aps.bat <my app> <app parameters> where <my app> is the location of your application and <app parameters> are the parameters used to run the application.
Application Performance Snapshot launches the application and runs the analysis.
Note
If it is the first time you are running the tool, it installs the appropriate drivers prior to beginning data collection.
Use the -u option to uninstall the driver. If you use both Application Performance Snapshot and Intel VTune Amplifier, uninstalling the driver can impact VTune Amplifier data collection.
After the analysis completes, a report appears automatically in the command window. You can also open a HTML report with the same information in a supported browser. The path to the HTML report is included in the command window.
Supported browsers include:
- Google Chrome* version 40 or later
- Microsoft Edge* version 12 or later
- Microsoft Internet Explorer* version 11 or later
- Mozilla Firefox* version 17 or later
- Safari* version 8 or later
Analyze the data shown in the report. See the metric descriptions below for more information.
Determine appropriate next steps based on result analysis. Common next steps may include application tuning or using another performance analysis tool for more detailed information, such as Intel VTune Amplifier or Intel Advisor.
Terminology
Elapsed Time: Execution time of specified application in seconds.
GFLOPS: Average Giga floating point operations per second performed by the application. GFLOPS metrics are only available for 3rd Generation Intel® Core™ processors, 5th Generation Intel processors, and 6th Generation Intel processors.
CPU Utilization: The effective CPU usage while the application was running. Overhead introduced by the parallel runtime system is not included in the CPU utilization calculation. A value of 100% means that all logical CPU cores were busy with application computations. Any value over 90% requires additional investigation.
Memory Bound: The percentage of potential processor execution pipeline slots lost while the application was fetching data. Stalls while fetching data are usually caused by load instructions causing execution to stall until the load is completed. In less common cases, a stall can be caused when incomplete stores imply back-pressure on the pipeline, which causes it to stall. Any value over 20% requires additional investigation.
FPU Utilization: The effective FPU usage while the application was running. Use the FPU Utilization value to evaluate the vector efficiency of your application. The value is calculated by estimating the percentage of operations that are performed by the FPU. A value of 100% means that the FPU is fully loaded. Any value over 50% requires additional analysis. FPU metrics are only available for 3rd Generation Intel Core processors, 5th Generation Intel processors, and 6th Generation Intel processors.