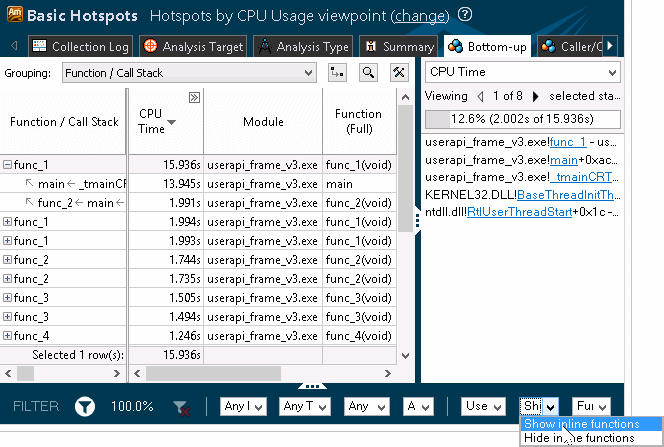
Configure the Intel® VTune™ Amplifier data view to display the performance data per inline functions for applications in the Release configuration.
This option is supported if you compile your code using
GCC* compiler 4.1 (or higher)
Intel® Composer XE (12.1.333) or higher, with the -debug inline-debug-info option enabled
To view data on inline functions:
Configure your application target and analysis type with the VTune Amplifier and run the analysis.
VTune Amplifier collects data and, by default, opens the results with the Inline Mode > Show inline functions enabled.
Analyze the collected data.
VTune Amplifier displays inline functions (virtual frames) as regular functions. For example, in the screen shot below, you can see a full list of inline functions and identify a real hotspot:

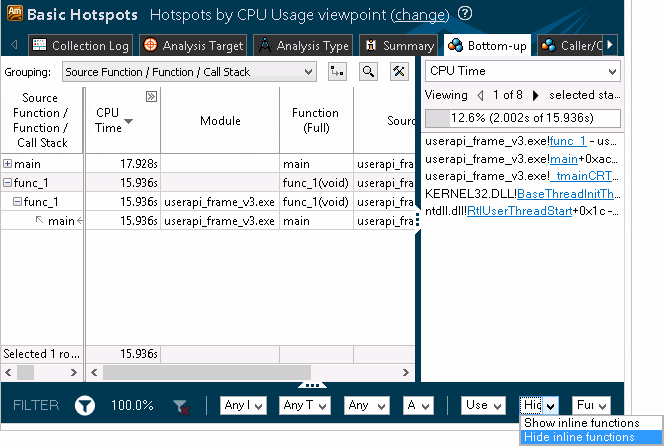
Analyze the source code for inline functions. You can select the Source Function/Function/Call Stack level in the Grouping menu to view all instances of the inline function in one row.
For the example above, if you double-click the func2 inline function, you can identify the code line that took the most CPU time.
To disable displaying inline functions:
On the filter toolbar, select Hide inline functions from the Inline Mode drop-down menu.
VTune Amplifier updates the viewpoint to display only regular functions. For example, in the example above, the Inline Mode option is disabled and the VTune Amplifier displays only 2 functions.

If you double-click this function entry and explore the source, you can see that all CPU time is attributed to the code line where inline function is called.