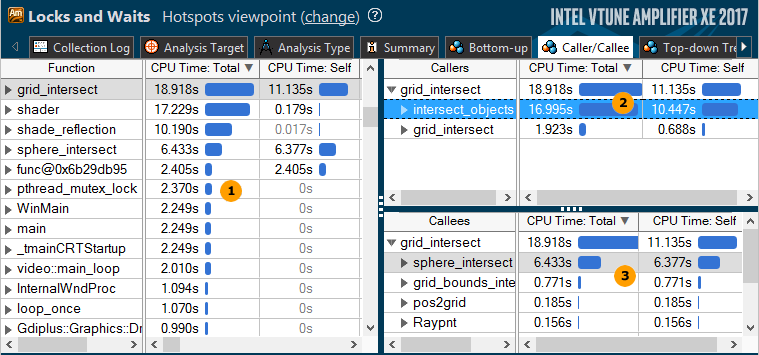
To access this window: Click the Caller/Callee sub-tab in the result tab.
The Caller/Callee window is available in all viewpoints that provide call stack data.
Use this window to analyze parent and child functions of the selected focus function and identify the most time-critical call paths.

|
Functions pane. The Functions pane displays a flat list of functions providing data per the following metrics:
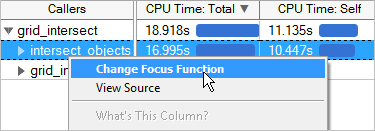
By default, the grid is sorted by the Total time metric. Select a function of interest in the grid (focus function) and explore its callers and callees on the right panes. You may select a function of interest and filter the grid to display the functions included into all subtrees that contain the selected function at any level. To do this, select the function, right-click and choose the Filter In by Selection context menu option. For the call tree view, switch to the Top-down Tree window. You can also change a focus function from the Callers or Callees panes by double-clicking a function of interest. Alternatively, you may select a function, right-click and choose the Change Focus Function context menu option, for example:
VTune Amplifier highlights this function in the Functions pane and updates the Callers and Callees panes to display its parent and child functions respectively. You can double-click a function of interest in the Functions pane to go to the source view and explore the function performance by a source line. |
|
Callers pane. The Callers pane shows parent functions (callers) for the function currently selected in the Functions pane. |
|
Callees pane. The Callees pane shows child functions (callees) for the function currently selected in the Functions pane. |


