You may configure the event-based sampling collector to analyze call stacks for your functions and identify performance, parallelism and power consumption issues.
Note
Make sure your kernel is configured to support event-based stack sampling collection.
Multitask operating systems execute all software threads in time slices (thread execution quanta). Intel® VTune™ Amplifier profiler handles thread quantum switches and performs all monitoring operations in correlation with the thread quantum layout.
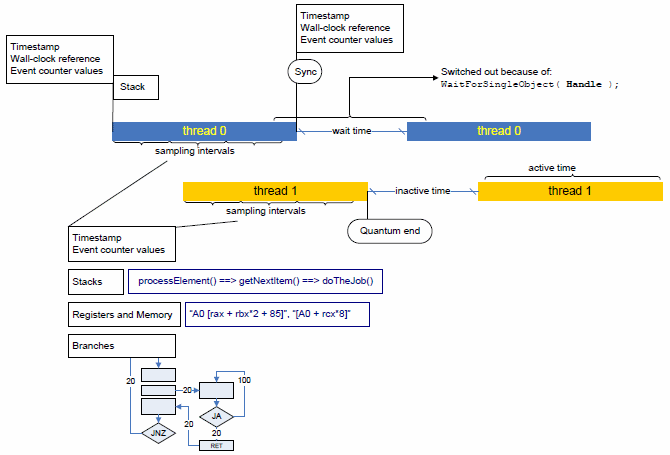
The figure below explains the general idea of per-thread quantum monitoring:

The profiler gains control whenever a thread gets scheduled on and then off a processor (that is, at thread quantum borders). That enables the profiler to take exact measurements of any hardware performance events or timestamps, as well as collect a call stack to the point where the thread gets activated and inactivated.
The profiler determines a reason for thread inactivation: it can either be an explicit request for synchronization (thread 0 calls the WaitForSingleObject function in the example above), or a so-called thread quantum expiration, when the operating system scheduler preempts the current thread to run another, higher-priority one instead.
The time during which a thread remains inactive is also measured directly and differentiated based on the thread inactivation reason: inactivity caused by a request for synchronization is called Wait time, while inactivity caused by preemption is called Inactive time.
While a thread is active on a processor (inside a quantum), the profiler employs event-based sampling to reconstruct the program logic and associate hardware events and other characteristics with the program code. Unlike the traditional event-based sampling, the profiler upon each sampling interrupt also collects:
call stack information
branching information (if configured so)
processor timestamps
All that allows for statistically reconstructing program execution logic (call and control flow graphs) and tracing threading activity over time, as well as collecting virtually any information related to hardware utilization and performance.
Note
Call stack analysis adds an overhead to your data collection. To minimize the overhead incurred with the stack size, use the Stack size option in the custom hardware event-based sampling configuration or -stack-size knob from CLI to limit the size of a raw stack. By default, a full stack is collected. If you disable this option, the overhead will be also reduced but no stack data will be collected.