Analyze performance per hardware event-based metrics in correlation with threads parallelism and function call flow.
If you enable the stack collection for a hardware event-based sampling analysis, the Intel® VTune™ Amplifier enhances the traditional event-based analysis providing various performance and parallelism metrics in correlation with each other, as well as with the actual code execution paths.
Analyze Performance
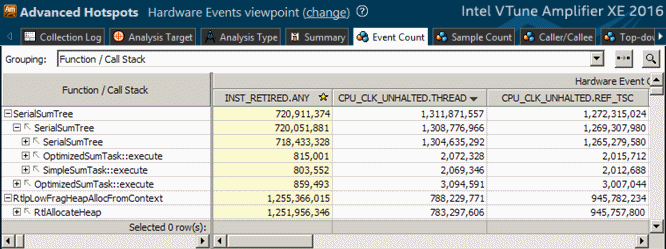
Select the Hardware Events viewpoint and click the Event Count tab. By default, the data in the grid are sorted by the Clockticks (CPU_CLK_UNHALTED) event count providing primary hotspots on top of the list.
Click the plus sign to expand each hotspot node (a function, by default) into a series of call paths, along which the hotspot was executed. VTune Amplifier decomposes all hardware events per call path based on the frequency of the path execution.

The counts of the hardware events of all execution paths leading to a sampled node sum up to the event count of that node. For example, for the _schedule function, which is the top hotspot of the application, the INST_RETIRED.ANY event count equals the sum of event counts for 7 calling sequences: 22 657 490 276 = 20 377 044 + 5 269 274 +0 + 718 190 701 + 21 857 068 455 + 26 565 167 + 30 019 635.
Such a decomposition is extremely important if a hotspot is in a third-party library function whose code cannot be modified, or whose behavior depends on input parameters. In this case the only way of optimization is analyzing the callers and eliminating excessive invocations of the function, or learning which parameters/conditions cause most of the performance degradation.
Explore Parallelism
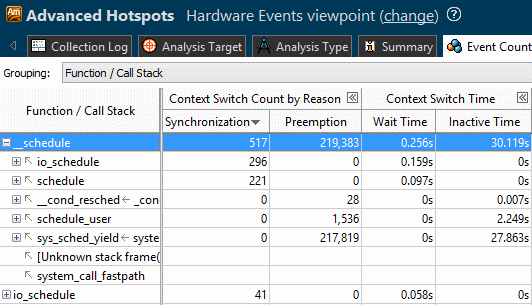
When the call stacks collection is enabled, the VTune Amplifier analyzes context switches and displays data on the threads activity using the context switch performance metrics.
Click the Synchronization Context Switches column header to sort the data by this metric. The synchronization hotspots with the highest number of context switches and high Wait time values typically signals a thread contention on this stack.

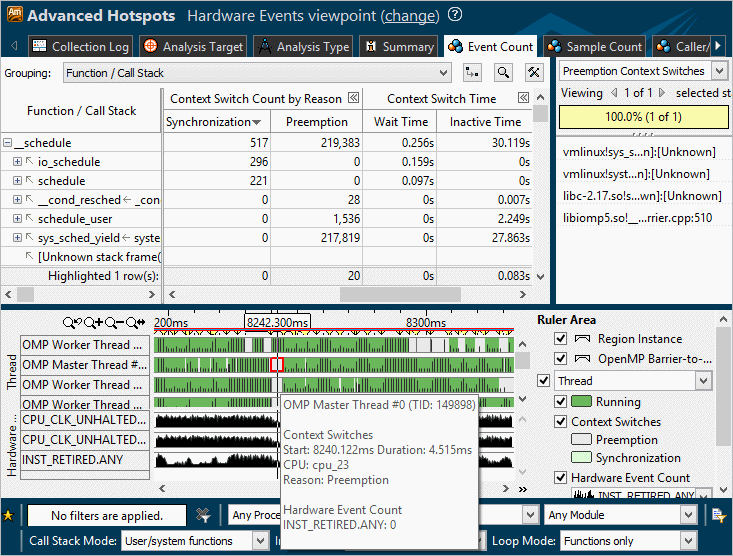
Select a context switch oriented type of the stack (for example, the Preemption Context Switches type) in the drop-down menu of the Call Stack pane and explore the Timeline pane that shows each separate thread execution quantum. A dark-green bar represents a single thread activity quantum, grey bars and light-green bars - thread inactivity periods (context switches). Hover over a context switch region in the Timeline pane to view details on its duration, start time and the reason of thread inactivity.

When you select a context switch region in the Timeline pane, the Call Stack pane displays a call sequence at which a preceding quantum was interrupted.
You may also select a hardware or software event from the Timeline drop-down menu and see how the event maps to the thread activity quanta (or to the inactivity periods).
Correlate data you obtained during the performance and parallelism analysis. Those execution paths that are listed as the performance hotspots with the highest event count and as the synchronization hotspots are obvious candidates for optimization. Your next step could be analyzing power metrics to understand the cost of such a synchronization scheme in terms of energy.
Note
The speed at which the data is generated (proportional to the sampling frequency and the intensity of thread synchronization/contention) may become greater than the speed at which the data is being saved to a trace file, so the profiler will try to adapt the incoming data rate to the outgoing data rate by not letting threads of a program being profiled be scheduled for execution. This will cause paused regions to appear on the timeline, even if no pause was explicitly requested. In ultimate cases, when this procedure fails to limit the incoming data rate, the profiler will begin losing sample records, but will still keep the counts of hardware events. If such a situation occurs, the hardware event counts of lost sample records will be attributed to a special node: [Events Lost on Trace Overflow].