A Viewpoint is a preset result tab configuration that selects particular data collected during a performance analysis and enables you to focus on specific performance problems.
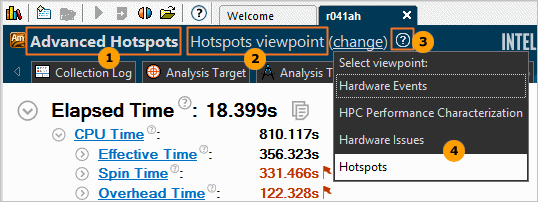
When you select a viewpoint, you select a set of performance metrics the Intel® VTune™ Amplifier shows in the windows of the result tab. To select the required viewpoint, click the (change) link and use the drop-down menu at the top of the result tab:
|
Name of the analysis type you ran. |
|
Name of the current viewpoint. |
|
Viewpoint description icon. Click the question mark icon to read a short overview of the selected viewpoint. To disable/enable the automatic display of the viewpoint description, in the Options dialog box > General tab deselect/select the Show the analysis description when the result opens option. |
|
Viewpoint drop-down menu that displays a list of viewpoints available for the current analysis type. Click the (change) link to open the menu and select a viewpoint. |


Explore the table below to understand which viewpoints are available for each analysis type:
Viewpoint |
Description |
|---|---|
Hotspots |
Helps identify hotspots - code regions in the application that consume a lot of CPU time. |
Hotspots by CPU Usage |
Helps identify hotspots - code regions in the application that consume a lot of CPU time. CPU time is broken down into CPU usage states: idle, poor, fair, and good. |
Hotspots by Thread Concurrency |
Helps identify hotspots - code regions in the application that consume a lot of CPU time. CPU time is broken down into thread concurrency states: idle, poor, fair, good, and over. |
Locks and Waits |
Shows how your application is utilizing available CPU cores and helps identify the cause of ineffective utilization, for example: threads waiting too long on synchronization objects (locks), I/O, or timers while CPU cores are underutilized. CPU time is represented by bars colored according to the CPU utilization level during the wait. |
Hardware Events |
Displays statistics of monitored hardware events: estimated count and/or the number of samples collected. Use this view to identify code regions (modules, functions, code lines, and so on) with the highest activity for an event of interest. |
Hardware Issues |
Helps identify where the application is not making the best use of available hardware resources. This viewpoint displays metrics derived from hardware performance counters. Hover over the highlighted metrics values in the grid to read why the extreme value might represent a performance problem. |
General Exploration |
Helps identify where the application is not making the best use of available hardware resources. This viewpoint displays metrics derived from hardware events. The Summary window reports the overall metrics for the entire execution along with explanations of the metrics. From the Bottom-up and Top-down Tree windows you can locate the hardware issues in your application. Cells are highlighted when potential opportunities to improve performance are detected. Hover over the highlighted metrics in the grid to see explanations of the issues. |
Memory Usage |
Helps understand how effectively your application uses memory resources and identify potential memory access related issues like excessive access to remote memory on NUMA platforms, hitting DRAM or Intel® QuickPath Interconnect (Intel QPI) bandwidth limit, and others. It provides various performance metrics for both the application code and memory objects arrays. |
HPC Performance Characterization |
Helps understand how effectively your application uses CPU, memory, and floating-point operation resources. Use this view to identify scalability issues for Intel OpenMP and MPI runtimes as well as next steps to increase memory and FPU efficiency. |
Disk Input and Output |
Shows disk input/output data, CPU and bus utilization statistics correlated with the execution of your target. Use this view to identify long latency of I/O requests, explore call stacks for I/O functions, analyze slow I/O requests on the timeline and identify imbalance between I/O and compute operations. |
GPU Hotspots |
Helps identify GPU tasks with high GPU utilization and estimate its effectiveness. It is particularly useful for analysis of the OpenCL™ kernels and Intel Media SDK tasks. Use this view to identify the most time-consuming GPU computing tasks, analyze GPU tasks execution over time, explore the GPU hardware metrics per GPU architecture blocks, and so on. |
Platform Power Analysis |
Helps identify where the application is generating idle and wake-up behavior that can lead to inefficient use of energy. Where possible, it provides data from both the OS and hardware perspective, such as the detailed C-state residency report that shows the OS requested time in deep sleep states compared to the actual residency the hardware indicated. This viewpoint is available for VTune Amplifier for Systems only. |