Identify causes of energy waste on target systems.
Note
Energy analysis with the Intel® SoC Watch data collector is available for target Android*, Windows*, or Linux* devices and provided only with the Intel® VTune™ Amplifier for Systems.
After collecting energy data on a target system, import the resulting .pwr (for Linux* or Android* OS) or .sww1 (for Windows* OS) result file to your host system with Intel® VTune™ Amplifier for Systems installed. VTune Amplifier opens the collected results in the Platform Power analysis viewpoint.
To interpret the performance data provided during the energy analysis, you may follow the steps below:
Analyze Overall Statistics
Click the Summary tab to switch to the Summary window. The first section displays the summary statistics on the overall collection run time execution per power analysis metrics. To view the metric description, hover over the question mark icon:
See the various summary items that are shown, including Top 5 Causes of Core Wake-ups list, and Elapsed Time per Core Sleep State Histogram. Focus on decreasing the causes of core wake-up, increasing the time that core spend in the higher sleep states.
Explore the histogram to analyze the time spent in each sleep state for the entire system:
For example, in the histogram above, the application spent the most time in the C0 state, which means that the core was active during that time.
Tip
Click the Details link next to the table or graph title on the Summary tab to view more information about that metric in another tab.
Identify Cores with Highest Time Spent in C0 States
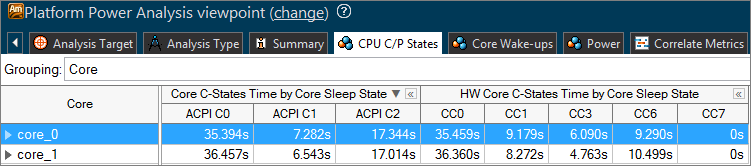
Switch to the CPU C\P States tab to identify cores with the highest time spent in the active C0 state. Spending more time in deeper sleep states (C1-Cn) provides greater power savings.
By default, VTune Amplifier displays data grouped by core and sorted by CPU time spent in the deepest C-state in the ascending order. For the example below, most of CPU time was spent in the C0 active state.
Identify Processor Wake-ups and Possible Causes
Switch to the Core Wake-ups tab and group the data by the Wake-up Reason/Wake-up Object/Function Stack to identify causes of the processor wake-ups.

For data collected from a Windows target system, click the + button for the timer and view the call stack for the wake-up object. Select a timer call stack row in the CPU Wake-ups pane to view a detailed timer wake-up call stack in the Call Stack pane on the right.
In the grid, you may select a wake-up object with the highest Wake-up Count, right-click it and select the Filter In by Selection from the context menu. VTune Amplifier will update the grid and timeline displaying the data relevant only for the selected object. The example below shows wake-ups per core initiated by the Timer object selected in the grid.
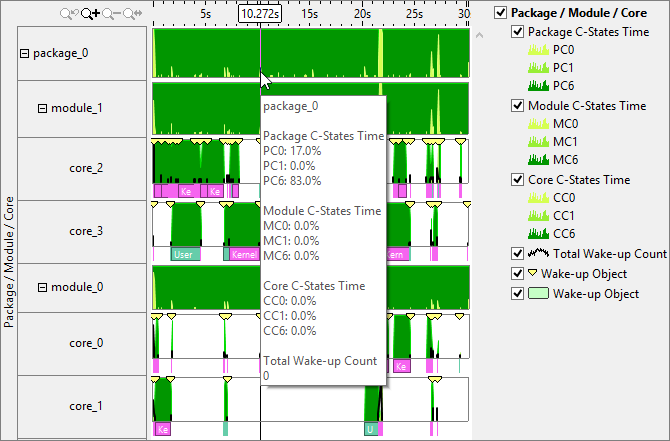
Hover over a chart point to view the sleep states details for the particular moment of time.
The deeper the color of the chart, the deeper the sleep state of the CPU. You may select a region of the graph and zoom into the selection to see detailed sleep state transitions.