Use the Intel® Energy Profiler tool, provided with the Intel® VTune™ Amplifier for Systems, to analyze power and energy consumption and identify system behaviors that waste energy on an Android*, Windows*, or Linux* OS system running on Intel architecture. Energy data collection is done using the Intel SoC Watch collector on either the system with VTune Amplifier for Systems installed or on a target system.
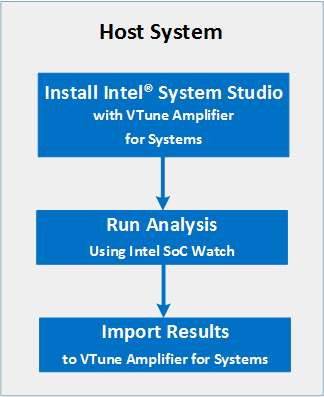
Energy Analysis on a Local System
Use the following high-level steps to identify system behaviors that waste energy on a target system (Windows* or Linux* only):

Install the appropriate version of Intel System Studio:
- Intel System Studio Professional Edition for Linux
- Intel System Studio Ultimate Edition for Linux
- Intel System Studio Professional Edition for Windows Target
- Intel System Studio Ultimate Edition for Windows Target
Run the data collection with Intel SoC Watch collector.
Data collection can occur on an idle system or run concurrently with a workload that is started at any time during the collection. For more information, see Intel SoC Watch Command Options or the Intel SoC Watch User's Guide (socwatch_<os>_users_guide.pdf), which is located in the \socwatch directory. The Getting Started or Quick Start sections of the guide contain collection commands to get you started.
The result file is saved to the results directory with the following file extension:
- Windows* OS: *.sww1
- Linux* OS: *.sw2 and *.pwr
Import the results to the VTune Amplifier for Systems project:
Launch VTune Amplifier GUI on the host system.
Open/Create a project.
Click the
 Import Result
button on the toolbar and browse to the
*.sww1 (for Windows OS)/
*.pwr (for Android or Linux OS) result file.
Intel Energy Profiler analysis data is opened in the default Platform Power Analysis viewpoint.
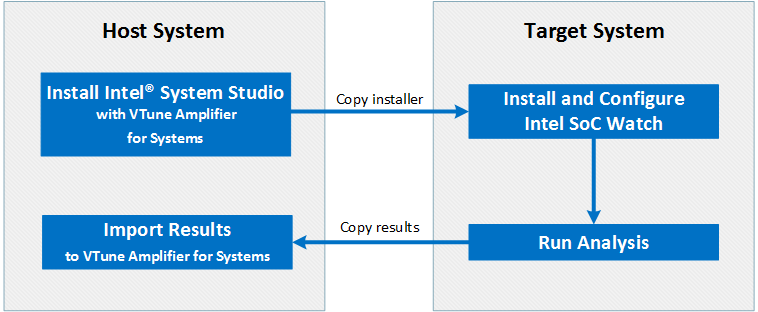
Energy Analysis on a Target System
Use the following high-level steps to identify system behaviors that waste energy on a target system (Windows*, Linux*, or Android*):

Install the appropriate version of Intel System Studio:
- For a Linux/Android
target:
- Intel System Studio Professional Edition for Windows Host
- Intel System Studio Ultimate Edition for Windows Host
- Intel System Studio Professional Edition for Linux
- Intel System Studio Ultimate Edition for Linux
- For a Windows target:
- Intel System Studio Professional Edition for Windows Target
- Intel System Studio Ultimate Edition for Windows Target
- For a Linux/Android
target:
Copy the collector package from the host system and install the collector:
- For an Android* target device, see Preparing a Target Android* System for Energy Analysis.
- For a Linux* target device, see Preparing a Target Linux* System for Energy Analysis.
Configure and run the data collection with Intel SoC Watch collector.
Data collection can occur on an idle system or run concurrently with a workload that is started at any time during the collection. For more information, see Intel SoC Watch Command Options or the Intel SoC Watch User's Guide (socwatch_<os>_users_guide.pdf), which is located in the \socwatch directory. The Getting Started or Quick Start sections of the guide contain collection commands to get you started.
The result file is saved to the results directory with the following file extension:
- Windows* OS: *.sww1
- Android* or Linux* OS: *.sw2 and *.pwr
Copy the *.sww1 (Windows*) or *.pwr (Linux* or Android*) result file to the host system.
Import the results to the VTune Amplifier for Systems project:
Launch VTune Amplifier GUI on the host system.
Open/Create a project.
Click the
 Import Result
button on the toolbar and browse to the
*.sww1 (for Windows OS)/
*.pwr (for Android or Linux OS) result file.
Intel Energy Profiler analysis data is opened in the default Platform Power Analysis viewpoint.
System Requirements for Installing the Intel SoC Watch Collector
Your host and target system operating systems determine the location of the Intel SoC Watch collector installation files. Use the following table to learn about the Intel architecture on which energy analysis can be run and to identify the location of the Intel SoC Watch data collector files that can be copied to your target system.
Android* OS
Target Intel Architecture: Refer to the Intel SoC Watch for Android Release Notes (socwatch_android_release_notes.pdf) for the latest supported architectures.
Data Collector: Intel SoC Watch (socwatch) data collector. Unzip the package on the host system: <install_dir>/system_studio_<version>/targets/system_studio_target.tgz
Note
The system_studio_target.tgz file is only available if Intel System Studio for Linux or Intel System Studio for Windows Host is installed.
Windows* 8 OS, or higher
Target Intel Architecture: Refer to the Intel SoC Watch for Windows Release Notes (socwatch_windows_release_notes.pdf) for the latest supported architectures.
Data Collector: Intel SoC Watch (socwatch) data collector. Copy the install package from the host system: <install_dir>\system_studio_for_windows_<version>\VTune Amplifier <version> for Systems\target\windows_socwatch\socwatch_windows_<version>.msi
Note
The Intel SoC Watch collector is installed on the host system as part of the Intel System Studio for Windows Target installation.
Linux* OS, kernel version 2.6.32 or higher
Target Intel Architecture: Refer to the Intel SoC Watch for Linux Release Notes (socwatch_linux_release_notes.pdf) for the latest supported architectures.
Data Collector: Intel SoC Watch (socwatch) data collector. Unzip the package on the host system: <install_dir>/system_studio_<version>/targets/system_studio_target.tgz
Note
The system_studio_target.tgz file is only available if Intel System Studio for Linux or Intel System Studio for Windows Host is installed.