Group the data by program units
|
Use the Timeline grouping menu to select
a grouping level:
A grouping level depends on the analysis
type. Selected grouping affects the metrics provided in the Timeline pane. If
some of the metrics are not supported for the selected grouping, this data does
not show up in the Timeline view and the legend is updated accordingly.
|
Sort the data
|
Right-click the list of
threads/cores/CPUs (depending on the analysis
type) and select the required type of sorting from the
Sort By content menu option:
Row Start Time sorts the rows by the thread
creation time.
Row Label sorts the rows
alphabetically.
<Metric> sorts
the rows by performance metric monitored for
the selected viewpoint, for example,
CPU
Time, Hardware Event Count, and others.
Ascending sorts the program
units in the ascending order by one of the categories selected above.
Descending sorts the program
units in the descending order by one of the categories selected above.
|
Re-order the rows
|
Select the row you need, hold and drag it to the required
position. Press
SHIFT to select multiple adjacent rows. Press
CTRL to select multiple disjointed rows.
|
Filter data
|
Select the required program unit(s),
right-click and choose from the context menu to filter in or filter out the
data in the view by the selected items. To go back to the default view, select
the
Remove All Filters option.
|
Zoom in and focus on a particular graph section
|
Drag and drop to select the range of interest.
Right-click and select
Zoom In on Selection from the context menu.
To restore the timeline to the previous state, right-click
and select
Undo Previous Zoom Selection. To restore the timeline
to the entire time interval (for example, after multiple zooming operations),
right-click and select
Reset Zoom from the context menu or click the
 Reset Zoom button on the
timeline toolbar. Reset Zoom button on the
timeline toolbar.
|
Zoom in/Zoom out the timeline
|
Click the
 Zoom In/ Zoom In/
 Zoom Out buttons on the
timeline toolbar. Zoom Out buttons on the
timeline toolbar.
|
Change the height of the row
|
Right-click and select the
Change Band Height option from the Timeline context
menu and select the required mode:
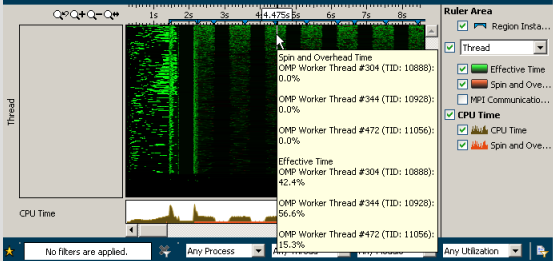
Super Tiny mode fits all
available rows (corresponding to program units such as processes, threads, and
so on) into the timeline area and display metric data in a gradient fill. This
mode is especially useful for results with multiple processes/threads since it
shows all the data in a compact way ("bird's-eye view") with no scroll bar. It
helps observe large numbers that are typical for high-end parallel applications
targeted, for example, for Intel® Xeon Phi™ coprocessors, and easily recognize
application phases and places of underutilization for further
zooming/filtering.
If there are more rows than pixels,
then multiple rows can share a pixel, in which case the pixel shows the maximum
value. If you hover over a chart object, the tooltip shows all of the rows
assigned to a pixel separately. If you resize the window, the timeline view is
re-drawn and pixels are re-shared.
If there is data, the active ranges
are colored: the more data associated with a pixel, the more intense color is
used for drawing. Otherwise, the band is shown in a black background color.
For hierarchical data, the
Super Tiny mode shows timeline data for the last
level of hierarchy aggregated by the upper levels. For example, for the
Process/Thread grouping you see threads data
aggregated by process. Hover over a chart element to view the full hierarchy
listed in the tooltip.
Note The
Super Tiny display mode is available only for
the viewpoints including the CPU Effective Time metric.
Tiny mode sets the small row
height (about 6px). This mode shows limited charts: if there is data, the
active ranges are colored; otherwise, the band is shown in a regular background
color. This mode also does not show time markers,
row identification (threads), and transitions. Rows cannot be reordered.
Normal mode sets the normal
row height (about 16-18px). This mode shows charts, time markers,
row identification (threads), and transitions. Rows can be reordered.
Rich mode sets the maximum row
height (35-50px). This mode shows charts, charts for nested tasks, time
markers,
row identification (threads), and transitions. Rows can be reordered and
their height can be manually adjusted.
|
Change the measurement units on the time
scale
|
Right-click, select the
Show Time Scale As
context menu option, and choose from the following
values:
Elapsed Time (default)
OS Timestamp
CPU Timestamp
|
Open the source view
|
Double-click the required transition/wait. The
Intel® VTune™ Amplifier
opens the
Source or, if symbol information is not available,
Assembly pane and highlights the corresponding
waiting/signaling call site.
|
Synchronize the selection with other panes
|
Select a thread/module of your interest. VTune Amplifier
automatically highlights the program units (for example, functions)
corresponding to the selected item in the
Bottom-up and
Top-down Tree panes.
|