Use the Disk Input and Output viewpoint to explore system-wide statistics on using the disk subsystem, CPU and processor buses, and correlate this data with the execution of your application.
Consider the following steps to interpret the data collected with the Disk Input and Output analysis:
All I/O metrics collected by the VTune Amplifier (for example, I/O Wait Time, I/O Waits, I/O Queue) are collected system-wide and are not target-specific. The only I/O data attributed to a particular target process is I/O API calls.
Analyze I/O Wait Time and Locate Slow I/O Packets
Start with the Summary window that provides a short overview of the target performance and, for Linux* targets, introduces the I/O Wait Time metric that helps you estimate whether your application is I/O-bound:
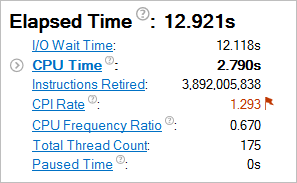
The I/O Wait Time metric represents a portion of time when threads reside in I/O wait state while there are idle cores on the system, and the number of counted threads is not greater than the number of idling cores. This aggregated I/O Wait Time metric is an integral function of I/O Wait metric that is available in the Timeline pane of the Bottom-up view.
Scroll down to the Disk Input and Output Histogram and estimate how quickly storage requests are served by the kernel sub-system. Use the Operation type drop-down menu to select the type of I/O operation you are interested in. For example, for the write type of I/O operations, 30 storage requests in all executed for more than 0.03 seconds are qualified by the VTune Amplifier as slow:
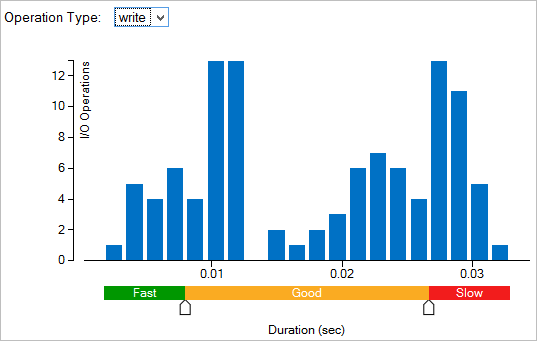
To get more details on this type of I/O request, switch to the Bottom-up window.
Analyze Slow I/O Requests
In the Bottom-up window, you may select an area of interest on the timeline, right-click and select the Zoom In and Filter In by Selection context menu option. The grid view and context summary histogram will be updated to show the data for the selected time range. In the example above there were 30 slow write requests executed between the 5th and 7th second of the target execution.
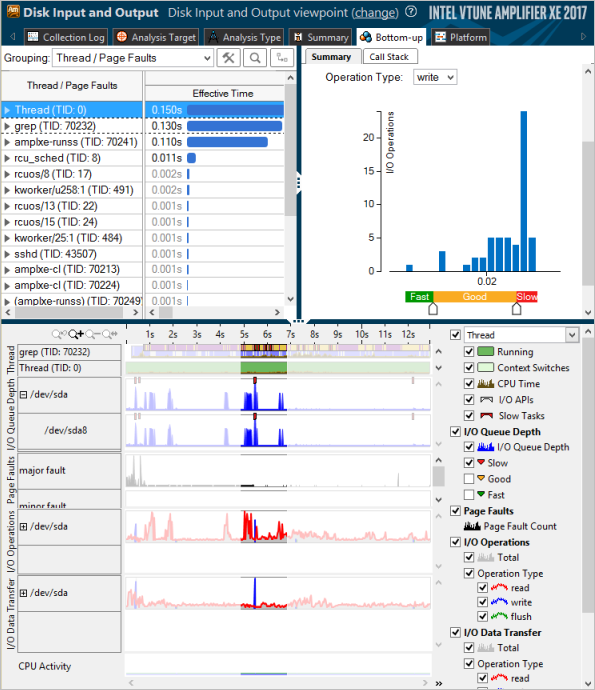
When you zoom in to the area of interest, you can have a closer look at all the metrics and understand what caused high I/O Wait time.
For Linux targets, the VTune Amplifier collects the I/O Wait type of context switches caused by I/O accesses from the thread (slate blue bars in the Thread area) and also provides a system-wide I/O Wait metric in the CPU Activity area. Use this metric data to identify imbalance between I/O and compute operations. System-wide I/O Wait shows the time when system cores are idle, but there are threads in a context switch caused by I/O access. Use this metric to estimate the performance dependency on the storage medium. For example, 100% value of the I/O Wait metric means that all cores of the system are idle, but there are threads (greater or equal than the number of CPU cores) blocked by I/O requests. To solve this problem, consider changing the logic of an application to run compute threads in parallel with I/O tasks. Another alternative is to use faster storage. 0% value of the I/O Wait metric means one of the following:
Regardless of the number of threads blocked on a storage access, all CPU cores are actively executing the application code.
There are no threads blocked on a storage access.
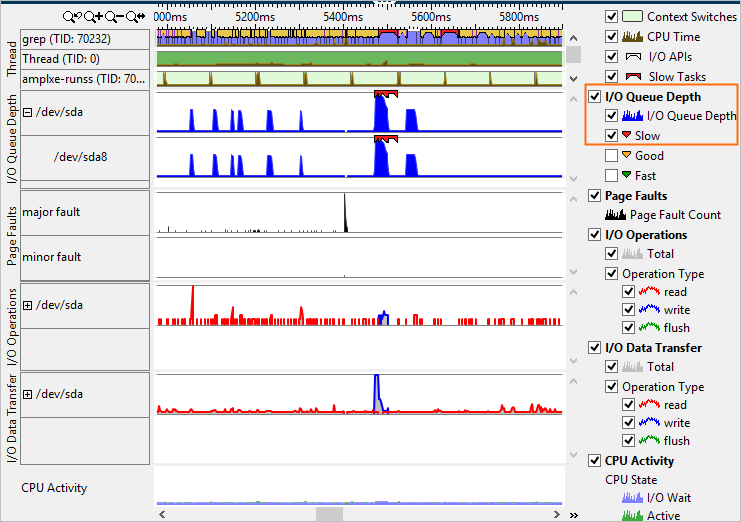
Explore the I/O Queue Depth area that shows the number of I/O requests submitted to the storage device. Spikes correspond to the maximum number of requests. Zero-valued gaps on the I/O Queue Depth chart correspond to the moments of time when the storage was not utilized at all. You may enable the Slow markers for the I/O Queue Depth metric to see where exactly slow I/O packets are scheduled for execution:
To identify points of high bandwidth, analyze the I/O Data Transfer area. It shows the number of bytes read from or written to the storage device.
For server platforms based on the Intel microarchitecture code name Sandy Bridge EP and later, the VTune Amplifier provides the PCIe Bandwidth metric on the timeline that represents an amount of data transferred via the PCIe bus per second. Use this metric to identify time ranges where your application could be stalled due to approaching bandwidth limits of the PCIe bus. This metric does not attribute I/O requests to threads/cores/sockets (see Uncore Event Count window in the Hardware Events viewpoint for that).
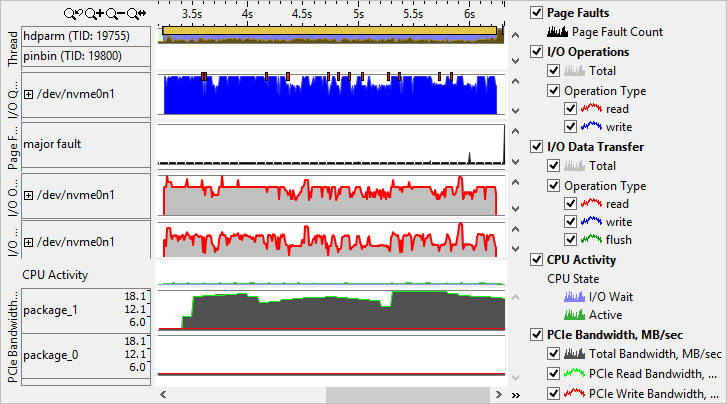
In the example above, the target's performance is optimal: the nvme0n1 device connected via PCIe bus is intensively used within available PCIe bandwidth limits.
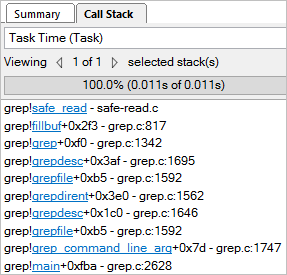
Analyze the Call Stack for I/O Functions
Correlate slow I/O requests with instrumented user-space activities. For the storage analysis, the VTune Amplifier instruments all user-space I/O functions and enables you to view a full call stack pointing to the exact API invocation.
To view a Task Time call stack for a particular I/O API call, select the required I/O API marker on the timeline and explore the stack in the Call Stack pane: