Manage the Intel® VTune™ Amplifier view to display call stacks for user and system functions and estimate an impact of each stack on the performance metrics.
Intel VTune Amplifier provides call stack information in the Call Stack pane, Bottom-up pane, Top-down Tree, and Caller/Callee pane. You may use the following options to manage and analyze stacks in different views:
Changing Stack Layout
Manage the stack representation in the grid
(Bottom-up or
Top-down Tree pane) by using the
 /
/ stack layout toolbar
button.

The button dynamically changes according to the selected layout. For example, if the chain layout is selected for the view, the button changes to show an option to choose a tree layout, and vice versa.
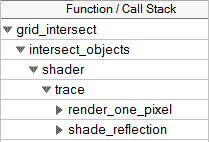
Chain layouts
 are
typically more useful for the bottom-up view:

While tree layouts
 are
more natural for the top-down view:

Note
Chain layout in the Top-down Tree pane is possible only if there is no branching AND when all values of data columns are the same for the parent and for the child.
Navigating Between Stacks
To view stacks for the selected program unit, estimate stack
contribution, and identify the most performance-critical stack, use the
Call Stack pane and click the next/previous
![]() arrows .
arrows .
To view information on several stacks or program units, Ctrl-click to
select these stacks or program units in the
Bottom-up or
Top-down Tree pane. The
Call Stack pane shows the highest contributing stack from all
the selected stacks, with the contribution calculated based on the sum of all
selected stacks. All the stacks related to the selection are added to the tab
and you can navigate to them using the next/previous
![]() arrows.
arrows.
Note that though each stack in the Bottom-up pane corresponds to a call stack provided in the Call Stack pane, the number of tree branches in the Bottom-up grid does not necessarily equal the number of stacks in the Call Stack pane. Since the stack in the Bottom-up pane is function-based and the stacks in the Call Stack pane are line-number-based, the number of stacks in these views may differ.
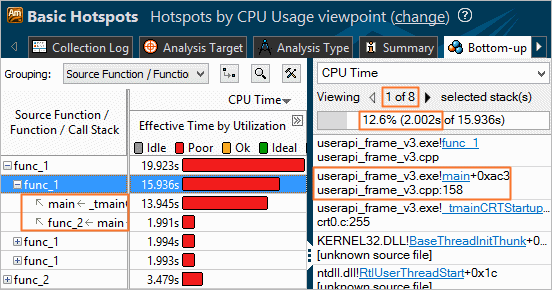
For example, in the screen capture below, the Bottom-up pane shows two stacks for the func_1 function whereas the Call Stack pane shows that 8 stacks exist.

|
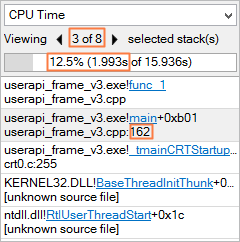
If you navigate between stacks in the Call Stack pane using the navigation buttons, you see that the func_1 function was called several times from the main function (in other words, had several call sites in this function): first time (first stack in the Call Stack pane) - from line 158 and, for example, the third time (third stack in the Call Stack pane) - from line 162. The Bottom-up pane aggregates stacks from different call sites into one and sums up their CPU time. For example, CPU time for the first stack under the func_1 function with 7 call sites is calculated as follows: 13.945s = 2.002s + 2.001s + 1.993s + 1.992s +1.990s +1.984s + 1.983s |
Viewing Stacks per Metric
Use the drop-down menu in the Call Stack pane, to choose the stack type for the selected program unit.
For example, when a synchronization object is selected in the Locks and Waits analysis result, you can set the Call Stack pane to show the stacks where that object was created, signaled or waited for.
Viewing System Functions in the Stack
To control whether you need the system functions show up in the stacks in the grid and Call Stack pane, use the Call Stack Mode menu provided on the filter toolbar.
Viewing Source for a Stack Function
If you double-click a row in the Call Stack pane or click a function name provided as a hyperlink, the source file opens in the Source/Assembly window on the code that generated the item in the selected row.
For example, in a Locks and Waits analysis result, if you double-click the topmost item of the Wait Time (Sync Object Creation) stack, the related source file opens on the source line that created the corresponding synchronization object.
If the source code is not found, you can either locate it manually, or open the Assembly pane for this program unit.
If you select a system function, the Source/Assembly window opens the source file of the system function if it is available. If not, it shows the disassembly for the binary file containing this system function.
