Use the Intel® VTune™ Amplifier Hardware Issues viewpoint for PMU analysis per hardware event-based metrics. This viewpoint highlights potential performance issues in your code, such as cache misses, branch mispredictions, contested accesses, and provides advice on possible optimizations for your hardware.
Each metric in the Hardware Issues viewpoint is an event ratio defined by Intel architects and has its own predefined threshold. VTune Amplifier analyzes a ratio value for each aggregated program unit (for example, function). When this value exceeds the threshold and the program unit has more than 5% of CPU time from collection CPU time, it signals a potential performance problem and highlights such a value in pink.
To interpret the performance data provided during the Hardware event-based sampling analysis, you may follow the steps below:
Learn Performance Metrics and Define a Performance Baseline
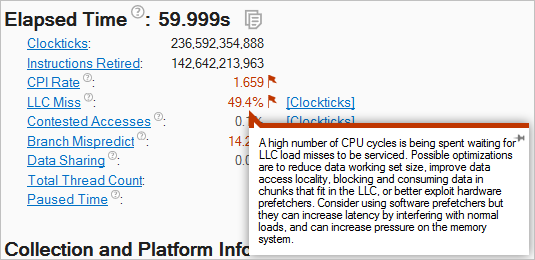
In the Hardware Issues viewpoint, click the Summary tab to switch to the Summary window. The first section displays the summary statistics on the overall application execution per hardware-related metrics measured as Clockticks or Pipeline Slots. To view a metric description, hover over the question mark icon:
In the example above, hovering over the LLC Miss metric displays the metric description in the tooltip. Values for the CPI Rate, LLC Miss, and Branch Mispredict metrics are flagged, which signals a performance issue for the whole application execution. Hover over a flagged value to see the description of a detected performance issue:
Use the performance issues identified by the VTune Amplifier as a baseline for comparison of versions before and after optimization. Your primary performance indicator is the Elapsed time value.
Grayed out metric values indicate that the data collected for this metric is unreliable. When you hover over such an unreliable metric value, the VTune Amplifier displays a message: This metric cannot be reliably calculated due to multiplexing issues or a low number of collected PMU samples. You may either ignore this data, or rerun the collection with the data collection time, sampling interval, or workload increased.
Identify Hardware Issues
To view hardware issues per a program unit, switch to the Bottom-up window. Each row represents a program unit and percentage of the CPU cycles used by this unit. Program units that take more than 5% of the CPU time are considered as hotspots. If you apply a filter, then the row needs to be more than 5% of the CPU time for just the data that was filtered in. For example, if a function is 2.5% of the CPU time, but you filter out half of the modules, then the function will be highlighted because it is 5% of what is left.
By default, the VTune Amplifier sorts the data in the descending order and provides the hotspots at the top of the list.
Each column in the Bottom-up window represents a hardware performance metric. VTune Amplifier calculates a metric based on the formulae provided by Intel architects and checks the threshold defined for this metric. If the metric value exceeds the threshold and the program unit is a hotspot, the VTune Amplifier highlights this value in pink as performance-critical. Hover over each pink cell to read a description of the issue and recommended solution and view the formula used to calculate the threshold for this issue.
In the example above, the VTune Amplifier identified the price_out_impl function as a major hotspot for your application that took the most CPU time. VTune Amplifier detected that three types of hardware issues that impact the performance of this function: Clockticks per Instructions Retired (CPI), Last-level Cache Miss (LLC Miss), and Branch Mispredict. For example, to handle the LLC Miss issues during the execution of the price_out_impl function, 36.7% of CPU cycles were waiting for data to arrive. This means that if you focus on this function hotspot and optimize the memory access, you can potentially gain up to 36% of performance boost for this function.
Analyze Source
When you identified a critical function, double-click it to open the Source/Assembly window and analyze the source code. The Source/Assembly window displays event data. Focus on the events included into the hardware metric identified as performance-critical in the Bottom-up pane. You may sort the columns to locate the required event data leftmost or set the required event column as a Data of Interest via the context menu. The Data of Interest event is used for the hotspot navigation. VTune Amplifier remembers your settings and restores them each time you open your result.
Explore Other Analysis Types
Typically, for the hardware event-based analysis, you are recommended to start with the General Exploration analysis type to collect the maximum number of information and identify where you have hardware issues. Thus, for example, if during the General Exploration analysis you see LLC Miss issues, you may run the Memory Access analysis type to get more detailed information on memory issues.
Run the comparison analysis to understand the performance gain you obtain after your optimization.
Note
For information on processor event, click the
 Help toolbar button and select
Intel Processor Event Reference from the drop-down menu.
Help toolbar button and select
Intel Processor Event Reference from the drop-down menu.
For information on the performance tuning for HPC-computers using the event-based sampling collection, see http://software.intel.com/en-US/articles/processor-specific-performance-analysis-papers/.