Use the Summary window as your starting point of the performance analysis with the Intel® VTune™ Amplifier. To access this window, select the Hardware Issuesviewpoint and click the Summary sub-tab in the result tab.
The Hardware Issues viewpoint helps identify where the application is not making the best use of available hardware resources. This viewpoint displays metrics derived from hardware performance counters. Hover over the highlighted metrics values in the grid to read why the extreme value might represent a performance problem. Depending on the analysis configuration, the Summary window provides the following data in this viewpoint:
Note
You may click the
 Copy to Clipboard button to copy the content of the selected
summary section to the clipboard.
Analysis Metrics
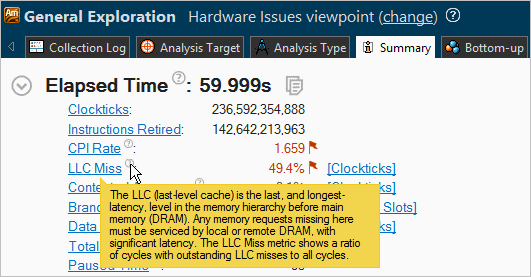
The first section displays the summary statistics on the overall application execution per hardware-related metrics defined by Intel architects. To view a metric description, hover over the question mark icon:

Most of the metrics are event ratios defined by Intel architects and have their own predefined thresholds. When a metric value exceeds the threshold and the application has more than 5% of CPU time from collection CPU time, it signals a potential performance problem and highlights such a value in pink. In the example above, values for the CPI Rate and LLC Miss metrics are highlighted in pink, which signals a performance issue for the whole application execution. VTune Amplifier describes each detected performance issue under the corresponding metric entry. Formulae used for calculating performance issues thresholds are provided in the Bottom-up window when you hover over a critical value (in pink) in the grid.
Use the performance issues identified by the VTune Amplifier as a baseline for comparison of versions before and after optimization. Your primary performance indicator is the Elapsed time value.
Grayed out metric values (see Contested Accesses, Branch Mispredict and Data Sharing in the example above) indicate that the data collected for this metric is unreliable. This may happen, for example, if the number of samples collected for PMU events is too low. In this case, when you hover over such an unreliable metric value, the VTune Amplifier displays a message: The amount of collected PMU samples is too low to reliably calculate the metric. You may either ignore this data, or rerun the collection with the data collection time, sampling interval, or workload increased.
Top Tasks
This section provides a list of tasks that took most of the time to execute, where tasks are either code regions marked with Task API, or system tasks enabled to monitor Ftrace* events, Atrace* events, Intel Media SDK programs, OpenCL™ kernels, and so on.
Clicking a task type in the table opens the grid view (for example, Bottom-up or Event Count) grouped by the Task Type granularity. See Interpreting Task Analysis Data for more information.
Collection and Platform Info
This section provides the following data:
Application Command Line |
Path to the target application. |
Operating System |
Operating system used for the collection. |
Computer Name |
Name of the computer used for the collection. |
Result Size |
Size of the result collected by the VTune Amplifier. |
Collection start time |
Start time (in UTC format) of the external collection. Explore the Timeline pane to track the performance statistics provided by the custom collector over time. |
Collection stop time |
Stop time (in UTC format) of the external collection. Explore the Timeline pane to track the performance statistics provided by the custom collector over time. |
CPU Information |
|
Name |
Name of the processor used for the collection. |
Frequency |
Frequency of the processor used for the collection. |
Logical CPU Count |
Logical CPU count for the machine used for the collection. |
Physical Core Count |
Number of physical cores on the system. |
User Name |
User launching the data collection. This field is available if you enabled the per-user event-based sampling collection mode during the product installation. |
GPU Information |
|
Name |
Name of the Graphics installed on the system. |
Vendor |
GPU vendor. |
Driver |
Version of the graphics driver installed on the system. |
Stepping |
Microprocessor version. |
EU Count |
Number of execution units (EUs) in the Render and GPGPU engine. This data is Intel® HD Graphics and Intel® Iris™ Graphics (further: Intel Graphics) specific. |
Max EU Thread Count |
Maximum number of threads per execution unit. This data is Intel Graphics specific. |
Max Core Frequency |
Maximum frequency of the Graphics processor. This data is Intel Graphics specific. |
Graphics Performance Analysis |
GPU metrics collection is enabled on the hardware level. This data is Intel Graphics specific. NoteSome systems disable collection of extended metrics such as L3 misses, memory accesses, sampler busyness, SLM accesses, and others in the BIOS. On some systems you can set a BIOS option to enable this collection. The presence or absence of the option and its name are BIOS vendor specific. Look for the Intel® Graphics Performance Analyzers option (or similar) in your BIOS and set it to Enabled. |