Use the
Intel® VTune™ Amplifier
to view a hierarchy of the loops in your application call tree and identify
code sections for optimization.
To view and analyze loops in your
application:
- Collect data and open the result.
Note
To
estimate loop iteration
counts and average trip counts, select the
Hotspots, call counts, loop trip counts and stacks
collection level option in the Advanced Hotspots analysis or enable the
Estimate trip counts option for the custom hardware
event-based sampling analysis.
- Select the required filtering level from the
Loop Mode drop-down menu on the Filter toolbar.
Loops only: Display loops as regular nodes in the
tree. Loop name consists of:
start address of the loop
number of the code line where this loop is created
name of the function where this loop is created
Loops and functions: Display both loops and
functions as separate nodes.
Functions only: Display data by function with no
loop information (default mode).
VTune Amplifier updates the grid according to
the selected filtering level.
- Analyze Self and Total metrics in the
Bottom-up and
Top-down Tree windows and identify the most time-consuming
loops.
- Double-click a loop of interest to view the source code.
VTune Amplifier opens a source file for the function with the
selected loop. The code line creating the loop is highlighted.
Note
You can see the code line information only if
debug information for your function is available.
Examples
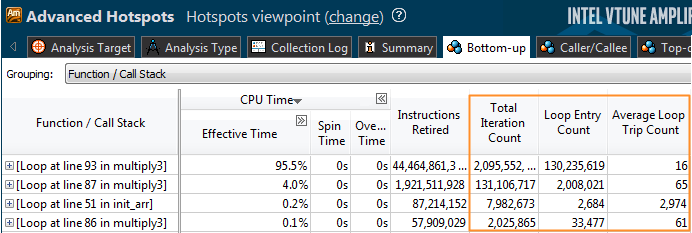
To identify the most time-consuming loop, select
the
Loops only mode in the
Bottom-up window. By default, loops with the highest CPU Time
values show up at the top of the grid.
To identify the heaviest top-level loops, switch to
the
Top-down Tree window. The data in the grid is sorted by the
Total time metric displaying the hottest top-level loops first:
If you enabled the loop trip counts estimation, you
may analyze how often a loop was entered using additional metrics: