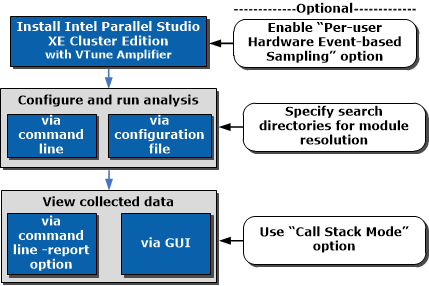
The following figure shows basic steps required to analyze performance of MPI applications with the Intel® VTune™ Amplifier integrated into the Intel Parallel Studio Cluster Edition.
To display more information about a workflow step:
- Position (hover) the mouse pointer to display a brief explanation.
- Click to display the associated topic.
Note
If clicking the workflow step does not display the associated topic, use the text links below the figure.

1. |
To collect performance data only for the current user, enable the Per-user Hardware Event-based Sampling option during installation of the VTune Amplifier. |
|
2 |
Configure and run MPI application analysis via amplxe-cl command line utility |
Use the mpirun or mpiexec tool to run the VTune Amplifier command line interface (amplxe-cl) and collect data about an application. By default, VTune Amplifier analyzes all processes but you may filter the data collection to limit it to a subset of processes. Notempirun is a higher-level command that dispatches to mpiexec or mpiexec.hydra. VTune Amplifier collects data, automatically finalizes data (resolves symbol information), and creates a number of result directories per compute node in the current project directory encapsulating the data for all the ranks running on the node in the same directory. For proper symbol resolution, you may need to adjust the search settings using the -search-dir option. |
3. |
Open the content of each result directory via the VTune Amplifier standalone graphical interface to analyze data for a specific process. Alternatively, you may use amplxe-cl -report option to view the collected data from the command line. |
Note
The file system contents should be the same on all nodes to make sure that the modules referenced in the collected data are available automatically on the host where the collection was initiated. To overcome this limitation, you can manually copy the modules for analysis from the nodes and adjust the VTune Amplifier project search directories.
For the VTune Amplifier, the CPU model and stepping should be the same on all nodes so that the hardware event-based sampling operates with the same Performance Monitoring Unit (PMU) type on all nodes.