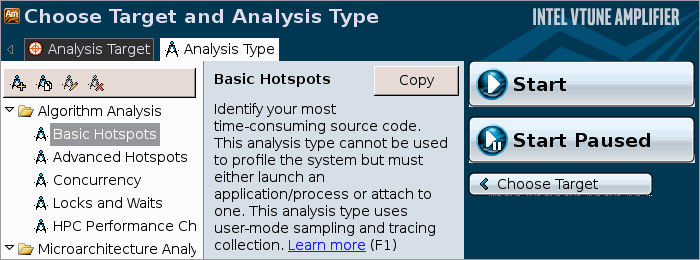
 Before running an analysis,
choose a configuration level to influence Intel® VTune™ Amplifier analysis
scope and running time. In this tutorial, you run the Basic Hotspots
analysis to identify the hotspots that took much time to execute.
To run an analysis:
- In the Choose Target and Analysis Type window, switch to the Analysis Type tab.
From the analysis tree on the left, select Algorithm Analysis > Basic Hotspots.
The right pane is updated with the default options for the Basic Hotspots analysis.
Click the Start button on the right command bar to run the analysis.

VTune Amplifier launches the tachyon_find_hotspots application that takes the balls.dat as input and renders an image displaying the execution time before exiting. VTune Amplifier finalizes the collected results and opens the Hotspots by CPU Usage viewpoint.
To make sure the performance of the application is repeatable, go through the entire tuning process on the same system with a minimal amount of other software executing.
Note
This tutorial explains how to run an analysis from the VTune Amplifier graphical user interface (GUI). You can also use the VTune Amplifier command-line interface (amplxe-cl command) to run an analysis. For more details, check the Command Line Interface Support section of the VTune Amplifier Help.