 You optimized your code to apply a loop interchange mechanism
that gave you
19.633 seconds of improvement in the
application execution time. To understand whether you got rid of the hotspot
and what kind of optimization you got per function, re-run the Basic Hotspots
analysis on the optimized code and compare results:
You optimized your code to apply a loop interchange mechanism
that gave you
19.633 seconds of improvement in the
application execution time. To understand whether you got rid of the hotspot
and what kind of optimization you got per function, re-run the Basic Hotspots
analysis on the optimized code and compare results:
Compare Results Before and After Optimization
Run the Basic Hotspots analysis on the modified code.
VTune Amplifier collects data and opens the result in the Result tab. Make sure to close the results before comparison.
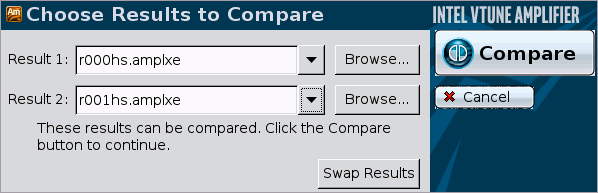
Select the result in the Project Navigator, right-click and choose Compare Results from the context menu.
The Compare Results window opens.
Specify the Basic Hotspots analysis results you want to compare and click the Compare Results button:
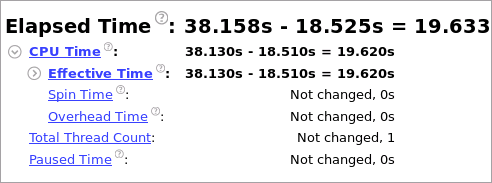
The Hotspots Summary window opens, providing a high-level picture of performance improvements in the following format: <result 1 value> - <result 2 value>.
Identify the Performance Gain
In the Summary window, you see that the Elapsed time shows 19.633 seconds of optimization for the whole application execution:
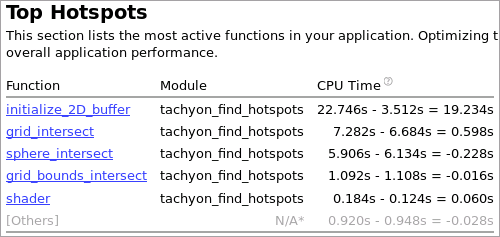
The Top Hotspots section shows the gain in performance for the most critical functions:
Switch to the Bottom-up window to compare the two results and see the differences per metrics side by side.