To access this window in the Refinement Report, double-click a data row or use the corresponding context menu item to view the source code associated with a Problem, Message, or Code Location.
Use this window to examine the source code for a selected site. To modify your source code, double-click a source line or use the Edit Source context menu item to display that file in a code editor.When using the Intel Advisor GUI, the editor defined by the Options > Editor dialog box appears with the file open at the corresponding location.
|
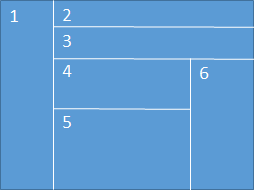
Memory Access Patterns Source Window Layout
|
|
|
Use This |
To Do This |
|---|---|
|
Run a tool of your choice and see results in the Result tab. |
|
|
Select between available reports. |
|
|
Assembly and Source view activation pane |
Enable source and assembly representations of the selected loop code. |
|
View user-visible source code representation of the selected loop. |
|
|
View assembly representation of the selected loop's code. |
|
|
Details View |
View detailed description of all memory access patterns found for the selected row. |