After the Suitability tool
 runs your program's target executable to collect data, the
Suitability Report window appears. It displays the approximate predicted performance based on its analysis of the annotated parallel sites and tasks.
runs your program's target executable to collect data, the
Suitability Report window appears. It displays the approximate predicted performance based on its analysis of the annotated parallel sites and tasks.
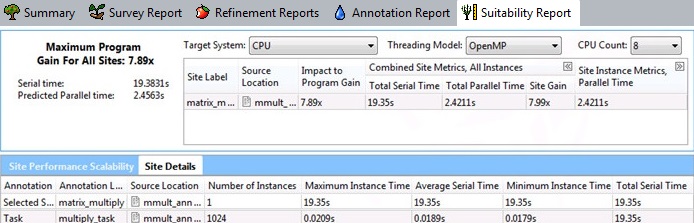
This screen shows data based on a Target System of CPU. The screen shown on your system will differ.
|
|
The upper-left area shows the Maximum Program Gain for All Sites in the program. Your overall goal of adding parallelism is to increase the Maximum Program Gain for All Sites so the parallel program will execute as fast as possible. The measured serial execution runtime, predicted parallel runtime, and any measured paused time are displayed below Maximum Program Gain for All Sites. Use the predicted Suitability gain values to help you make informed decisions about where to add parallelism. If the Suitability tool detects any annotation-related errors, they appear at the top of the Suitability Report window. If you see this type of error, the displayed Suitability data may not be reliable. Annotation-related errors may be caused when the correct sequence of annotations do not occur because of missing annotations, when unexpected execution paths occur, or if Suitability data collection was paused while the target was executing. |
|
|
Use the upper-right row of modeling parameters to model performance. Choose a hardware configuration and threading model (parallel framework) values from the drop-down lists. If you select a Target System for Intel® Xeon Phi™ processors, an additional value for total Coprocessor Threads appears. Below this row is a grid of data that shows the estimated performance of each parallel site detected during program execution. The
Site Label shows the argument to the site annotation. Examine the predicted
Site Gain and
Impact to Program Gain (higher values are better) to estimate how much each site contributes to the
Maximum Program Gain for All Sites for all sites (described above). To expand the data under
Combined Site Metrics or
Site Instance Metrics, click the
To view source code for a selected parallel site, click its row to display the Suitability Source window. To show or hide the side command toolbar, click the
|
|
|
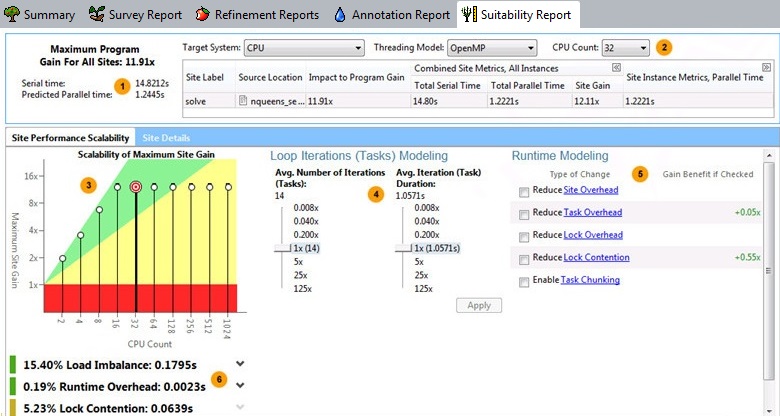
The Scalability of Maximum Site Gain graph summarizes performance for the selected site. The number of CPU processors or total number of coprocessor threads appears on the horizontal X axis and the target's predicted performance gain appears on the Y axis. To change the default CPU Count and the Maximum CPU Count, set the Options value (see Dialog Box: Options - General). If you choose a Target System of CPU, to view detailed characteristics of the selected site as well as its tasks and locks, click the Site Details tab. |
|
|
Use the Loop Iterations (Tasks) Modeling (or Tasks Modeling) modeling parameters to experiment with different loop structures, iteration counts, and instance durations that might improve the predicted parallel performance. For example, you might want to see the impact of modifying your nested change loop structure, modify the loop body code, or change number of iterations. If the task annotations indicate likely task parallelism, the title will appear as Task Modeling (instead of Loop Iterations (Task) Modeling for data parallelism). |
|
|
Use the Runtime Modeling modeling parameters to learn which parallel overhead categories might have an impact on parallel overhead. If you agree to address a category later by using the chosen parallel framework's capabilities or by tuning the parallel code after you have implemented parallelism, check that category. If the chosen Target System is Intel Xeon Phi or Offload to Intel Xeon Phi, additional Intel Xeon Phi Advanced Modeling options appear below the Runtime Modeling area. To expand this area, click the down arrow to the right of Intel Xeon Phi Advanced Modeling. |
|
|
Below the graph is a list of issues that might be preventing better predicted performance gains as well as a summary of serial and predicted parallel time. To expand a line, click the down arrow to the right of the item's name. Most issues are related to the Runtime Modeling modeling parameters. Later, you can use other Analyzer tools like Intel® VTune™ Amplifier to measure actual performance of your parallel program. |


 icon to the right of that heading; to collapse data, click
 to the right of that heading.
 or
or
 icon.
icon.


Target System Hardware Configurations
The Target System lets you select the type of hardware configuration to be analyzed. From this drop-down list, you can check each type to learn the likely predicted performance characteristics for each:
-
CPU shows the predicted performance of only the CPU. Choose this item for Intel® Xeon or similar processors that do not have significant parallel coprocessors. For a Intel® Xeon Phi™ processor, choose this setting to only model the host processor, such as an Intel® Xeon processor. If you choose this configuration, you can specify the CPU Count modeling parameter.
-
Intel Xeon Phi shows the predicted performance when using only the Intel Xeon Phi coprocessor cores, and not the host processor. This parameter does not account for data exchange amongst Intel Xeon Phi coprocessor cores and the host CPU. If you choose this configuration, you can specify the Coprocessor Threads modeling parameter.
-
Offload to Intel Xeon Phi shows the predicted performance when using Intel Xeon Phi coprocessor manycores to execute parallel code after the host CPU starts the program and before execution resumes on the host CPU for program completion. If you choose this configuration, you can specify the Coprocessor Threads and CPU Count modeling parameters.
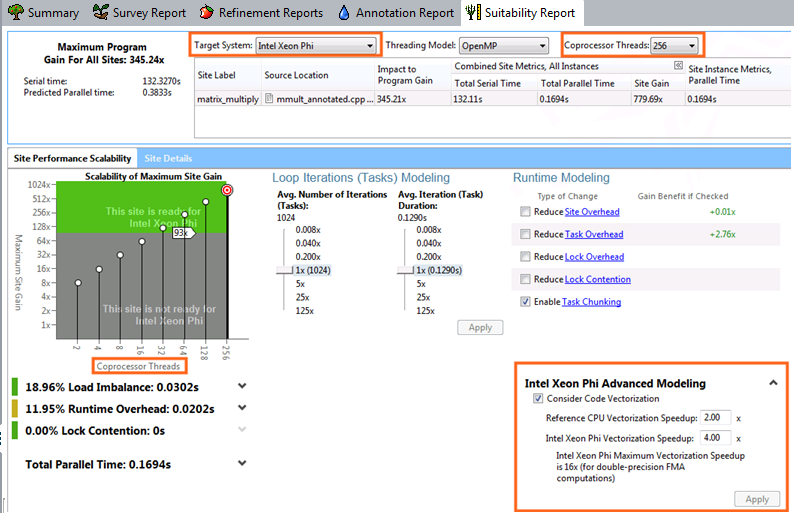
Data Displayed When the Target System is Intel Xeon Phi
A sample screen below shows changes in orange boxes when the Target System is Intel Xeon Phi (instead of CPU).
-
The displayed data changes, such as the Maximum Program Gain for All Sites and the serial and predicted parallel time.
-
The graph's appearance changes to a gray-green color and the X axis displays Coprocesser Threads (instead of CPU Count) to represent the predicted performance of the manycore parallel coprocessor. This graph shows the predicted parallel performance of the manycore parallel coprocessor without accounting for data exchange amongst Intel Xeon Phi coprocessor cores and the host CPU. For many applications, the number of task instances does not scale enough to fully utilize the many cores of the parallel coprocessor, as indicated by a hover tip. Applications that are not appropriate for a Intel Xeon Phi processing system have values that appears in the gray part of the graph; in this case, try modeling other types of the Target System.
-
The lines between the graph's gray and green areas is a reference baseline, where the reference CPU chosen to calculate the Intel Xeon processor peak baseline is a dual-socket 8-core Intel Xeon processor E5-26xx product family (2.7 GHz, 16 cores total). When the Maximum Site Gain exceeds this baseline, you might consider using an Intel Xeon Phi coprocessor rather than an Intel Xeon® or similar processor.
When the Target System is either Intel Xeon Phi or Offload to Intel Xeon Phi, the Intel Xeon Phi Advanced Modeling options appear. See Intel Xeon Phi Advanced Modeling.
Data and Modeling Parameters When the Target System is Offload to Intel Xeon Phi
A sample screen below shows changes in orange boxes when the Target System is Offload to Intel Xeon Phi (instead of CPU) and the Offload to Intel Xeon Phi column is selected.
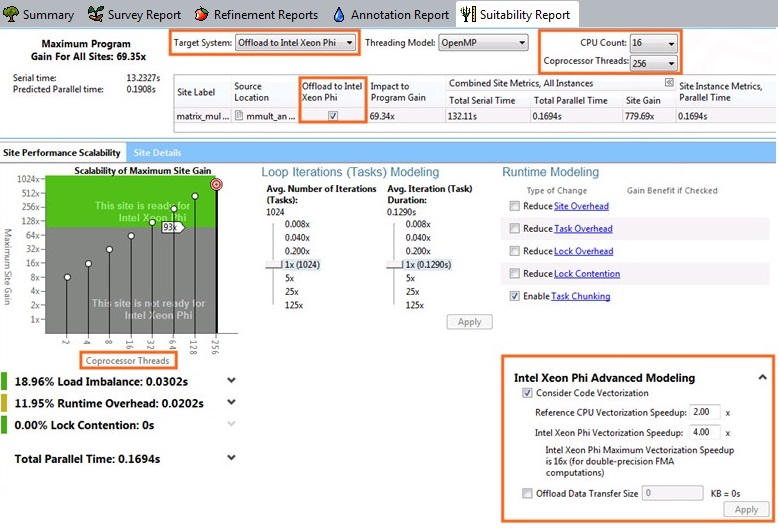
When you select a Target System of Offload to Intel Xeon Phi coprocessor:
-
The displayed data changes, such as the Maximum Program Gain for All Sites and the serial and predicted parallel time.
-
An additional modeling parameter appears as a new column for each site named Offload to Intel Xeon Phi. If selected, the Scalability of Maximum Site Gain graph displays Coprocessor Threads on the X axis. If unselected, the graph displays CPU Count on the X axis.
-
In the upper-right corner, an additional modeling parameter appears. That is, both the total number of Coprocessor Threads and the CPU Count appear because both the number of CPUs and the coprocessor's total number of hardware threads should be considered to predict parallel execution.
-
Additional modeling parameters appear below Runtime Modeling area under Intel Xeon Phi Advanced Modeling - see Intel® Xeon Phi™ Advanced Modeling.
-
When the column named Offload to Intel Xeon Phi is selected, the graph's appearance changes to a gray-green color and the X axis displays Coprocessor Threads instead of CPU Count. This graph shows the predicted performance of the manycore parallel coprocessor and its host CPUs. For many applications, the number of task instances does not scale enough to fully utilize the many cores of the parallel coprocessor, as indicated by a hover tip. Applications that are not appropriate for a Intel Xeon Phi processing system have values that appear in the gray part of the graph; in this case, try modeling other types of the Target System. Applications that are appropriate for offload to an Intel Xeon Phi processing system have values that appear in the green part of the graph.
The lines between the graph's gray and green areas is a reference baseline, where the reference CPU chosen to calculate the Intel Xeon processor peak baseline is a dual-socket 8-core Intel Xeon processor E5-26xx product family (2.7 GHz, 16 cores total). When the Maximum Site Gain exceeds this baseline, you might consider using an Intel Xeon Phi coprocessor rather than an Intel Xeon® or similar processor.
Site Details Tab
If you chose a Target System of CPU, after you click the Site Details tab (next to Site Performance Scalability), the lower part of the Suitability Report shows details about the selected site, as well as details about each task and lock within that site.