After the Survey tool
 runs with
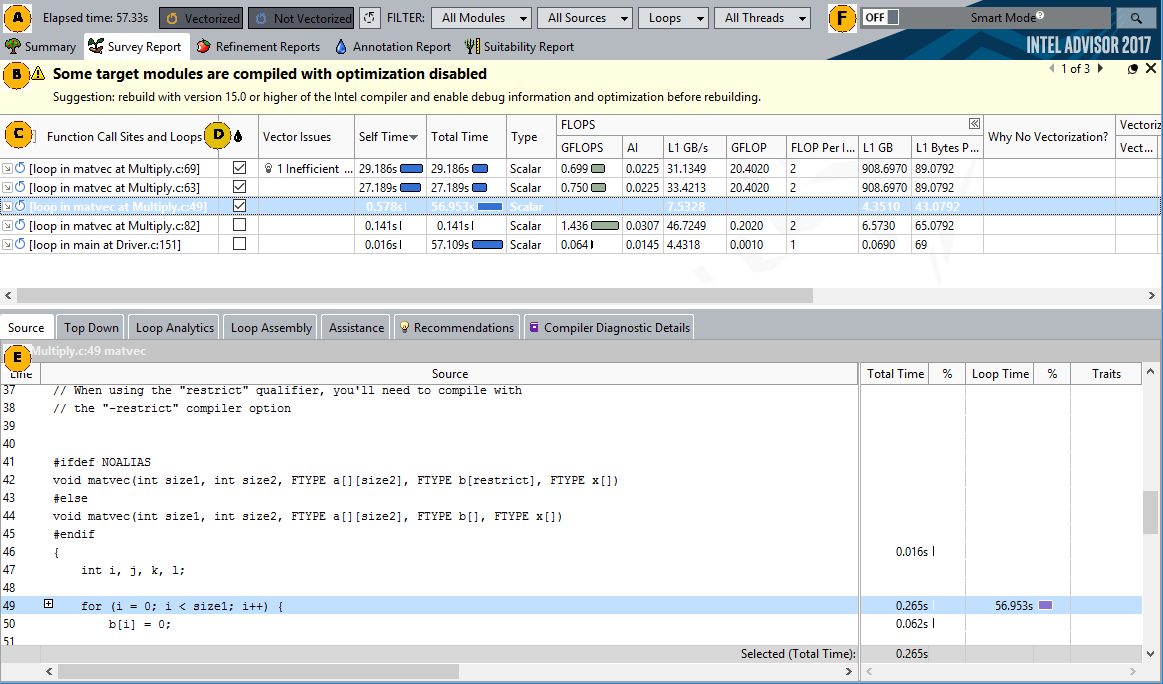
your program's target executable to collect data, the
Survey Report window appears. It displays a
top-down call tree with loops. When a target executes for a very short
duration, it may not be possible for the Survey tool to collect sufficient data
to provide a
Survey Report and a message appears instead (click
the link for the Troubleshooting help topic listed below under See Also).
runs with
your program's target executable to collect data, the
Survey Report window appears. It displays a
top-down call tree with loops. When a target executes for a very short
duration, it may not be possible for the Survey tool to collect sufficient data
to provide a
Survey Report and a message appears instead (click
the link for the Troubleshooting help topic listed below under See Also).
|
|
Use the small toolbar to view the survey analysis execution time, to hide and unhide Hot Loops that are vectorized and not vectorized, and to also filter the loops by several parameters of your choice. |
|
|
Problems and messages pane reports any warnings that might be useful. You can select between the messages or close the pane via the buttons in the top-right corner of the pane. |
|
|
The
Function Call Sites and Loops
column provides an extended top-down call tree of
your program's target, starting with the main entry point. You can scroll up
and down as well as show or hide functions and loops. Each function or loop
appears on a separate line. Loops are indicated by the loop
On any row, right click to view the context menu. |
|
|
The
|
|
|
The bottom area comprises the following:
|
|
|
Smart Mode switch. Move the slider to add or reduce the amount of loops displayed in the Survey report. If you choose to reduce the amount of loops to display, loops with highest total time are displayed. When switched ON, the Smart Mode also reduces the amount of columns displayed in the Survey report. |


 icon
under the function/procedure that executes it.
icon
under the function/procedure that executes it.

 column enables you to check loops for Deeper Analysis. The marked loops become
available for Dependencies and Memory Access Patterns tools in the
Vectorization Workflow.
column enables you to check loops for Deeper Analysis. The marked loops become
available for Dependencies and Memory Access Patterns tools in the
Vectorization Workflow.


To view details about a code region, use the Survey Source window. To open the Survey Source window either double-click a loop or right-click it and select View Source.