To access this window, in the
Result
tab, click the
Survey Report button, run the Survey
 tool, or click the icon on
the
Advisor Workflow tab.
|
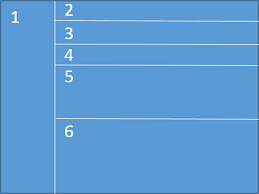
Survey Report Layout 
|
|
|
Use This |
To Do This |
|---|---|
|
Run a tool of your choice and see results in the Result tab. |
|
|
To view the report execution time, quickly hide and unhide vectorized and non-vectorized loops, or filter loops, functions, and threads. |
|
|
Select between available reports. |
|
|
Warnings and Messages Pane |
To view important messages about the current target's setup. |
|
View data collected by the Survey tool to
help you investigate the impact of functions and loops, including their
callees. It also lets you view source code associated with a specific function
or loop. Each function or loop appears on a separate line in the grid. Loops
are identified with an
Locate loops that consume significant CPU
time. Such loops are identified with a checkmark
|
|
|
Select between advanced views like Source, Top Down, Loop Assembly, Recommendations, and Compiler Diagnostic Details. |
|
|
Right-click a line in the Survey Report window grid |
Displays a context menu that lets you display the source code in the Survey Source window, edit source code in the code editor, copy the selected source code line(s) to the clipboard, or display context-sensitive help. |
|
Column label |
Click a column heading to sort the grid column in either ascending or descending order. |
To display the associated source code associated with a function or loop in the Survey Source window, double-click its data row, or right-click its data row and select View Source from the context menu.
To edit the source code associated with a function or loop directly in your code editor, right-click its data row and select Edit Source from the context menu. When using the Intel Advisor GUI, the editor defined by the Options > Editor dialog box appears with the file open at the corresponding location.
 icon, the
word
 in
the
Hot Loops column. The columns are
explained in the table below.