To access this window in the Survey Report window, double-click a line associated with a function or use the View Source context menu item. Use this window to examine the source code and the execution time for each source line.
|
Survey Source Layout 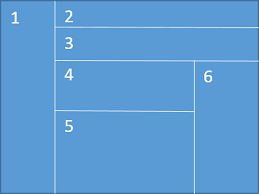
|
|
To modify your source code, use your code editor.
|
Use This |
To Do This |
|---|---|
|
Run a tool of your choice and see results in the Result tab. |
|
|
Select between available reports. |
|
|
Assembly and Source view activation pane |
Enable source and assembly representations of the selected loop code. |
|
Source view |
View user-visible source code representation of the selected loop. |
|
Assembly view |
View assembly representation of the selected loop's code. |
|
Call Stack view |
View the call stack for the selected code region. Click to display related code regions in the File: filename pane, or right click to display the context menu. |