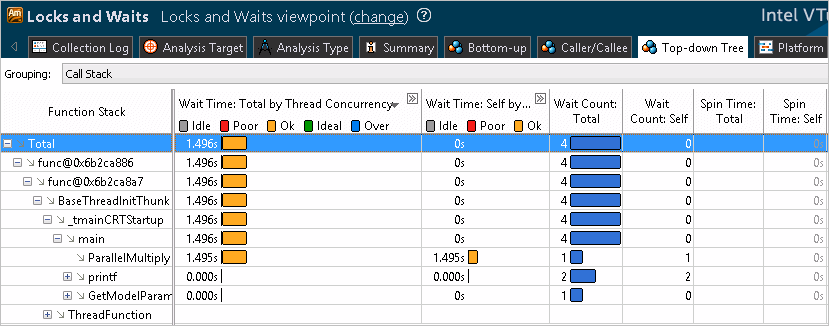
Correlate the data displayed in the Bottom-up window for each program unit (bottom-up analysis) and in the Top-down Tree window for an overall impact of each element together with its callees (top-down analysis).
The Top-down Tree window includes Self Time and Total Time columns for each data column in the Bottom-up window:

In the Locks and Waits viewpoint example above, columns in the Top-down Tree window match the columns in the Bottom-up window as follows:
Bottom-up Window |
Top-down Tree Window |
|---|---|
Wait Time by Thread Concurrency |
Wait Time: Total by Thread Concurrency Wait Time: Self by Thread Concurrency |
Wait Count |
Wait Count: Total Wait Count: Self |
Spin Time |
Spin Time: Total Spin Time: Self |
The Bottom-up window provides only Self type of data (function/synchronization object without callees). In the grid, Self time/Count column headers do not have :suffix.
The Total type of data (function/synchronization object + all callees' Self data) is provided in the <data>:Total column and unique to the Top-down Tree window. In the example above, these are the Wait Time:Total by Thread Concurrency, Spin Time:Total, and Wait Count:Total columns.
Self time for a program unit in the Bottom-up window equals the sum of Self time values for the same program unit in different call sequences in the Top-down Tree window.