Use the Intel® VTune™ Amplifier to profile applications that use a Graphics Processing Unit (GPU) for rendering, video processing, and computations. VTune Amplifier can monitor, analyze, and correlate activities on both the CPU and GPU.
Prerequisites: For Linux* targets, to analyze Intel HD and Intel Iris Graphics (further: Intel Graphics) hardware events on a GPU, make sure to install the Intel Media Server Studio (starting with version 2015 R5) and build the kernel driver as described in the Getting Started Guide.
Consider following these steps for GPU analysis with the VTune Amplifier:
Run CPU/GPU Concurrency analysis to identify whether your application is GPU bound.
Run the GPU Hotspots analysis for detailed analysis of the GPU-bound application with explicit support of Intel® Media SDK and OpenCL™ software technology:
Note
You may also configure a custom analysis to collect GPU usage data. To do this, select the Analyze GPU usage option in the analysis configuration. This option introduces the least overhead during the collection, while the Analyze Processor Graphics hardware events adds medium overhead, and the Trace OpenCL and Intel Media SDK programs option adds the biggest overhead.
Explore CPU/GPU Concurrency
Run the CPU/GPU Concurrency analysis to explore GPU usage over time and understand whether your application or some of its phases are CPU or GPU bound. This is the least-intrusive analysis that is available for applications running on platforms with Intel Graphics as well as on other third-party GPUs supported by the VTune Amplifier.
VTune Amplifier collects data and provides the analysis result in the GPU Hotspots viewpoint. The Summary window, which opens by default, provides high-level statistics on how your application uses CPU and GPU resources and helps you understand whether your application is GPU bound.
The example below shows an analysis result for a GPU bound application. From the Summary window, you see that GPU Time is a substantial fraction of Elapsed time:
Switch to the Platform window that provides basic CPU and GPU metrics to analyze GPU usage on a software queue and correlate this data with the CPU usage on the timeline. Theoretically, if the Platform window shows that the GPU is busy most of the time and having small idle gaps between busy intervals and the GPU software queue is rarely decreased to zero, your application is GPU bound. If the gaps between busy intervals are big and the CPU is busy during these gaps, your application is CPU bound. But such obvious situations are rare and you need a detailed analysis to understand all dependencies. For example, an application may be mistakenly considered GPU bound when GPU engines usage is serialized (for example, when GPU engines responsible for video processing and for rendering are loaded in turns). In this case, an ineffective scheduling on the GPU results from the application code running on the CPU.
When the GPU is intensely busy over time, you may switch to the Graphics window and look deeper to understand what kind of work it is running (rendering or computations) per thread.
In the Graphics window, the Timeline pane for the same result shows no gaps on the GPU Usage band:
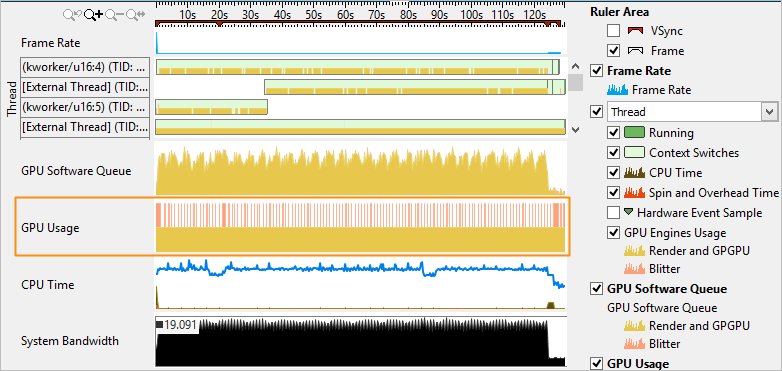
This example demonstrates an activity on the Render and GPGPU engine (yellow color) as well as an activity on Blitter engine (pink color).
Analyze GPU Usage for GPU-Bound Applications
If you already identified that your application or some of its stages are GPU bound, run the GPU Hotspots analysis to see whether GPU engines are used effectively and whether there is some room for improvement. Such an analysis is possible with hardware metrics collected by the VTune Amplifier for the Render and GPGPU engine of the Intel Graphics.
Explore GPU Hardware Metrics
GPU hardware metrics can provide you with a next level of details to analyze GPU activity and reason whether any performance improvements are possible. You may configure the GPU Hotspots analysis to collect the following types of GPU event metrics on the Render and GPGPU engine of Intel Graphics: Overview (collected by default), Compute Basic (with global/local memory accesses), and Compute Extended (for Intel® Core™ M processors and higher). You may enable their collection by selecting the Analyze Processor Graphics hardware events option during analysis configuration and specifying the required group. Typically you are recommended to start with the Overview group of events group that analyze general activity of GPU execution units, sampler, general memory and cache accesses, and then move to the Compute Basic (global/local memory accesses) group to analyze accesses to different types of GPU memory. Compute Basic metrics are most effective when you analyze computing work on a GPU with the Analyze GPU usage events option enabled (default for the GPU Hotspots analysis), which allows you to correlate GPU hardware metrics with an exact GPU load. You may also select a Full Compute (preview) event group that combines metrics from the Overview and Compute Basic presets and presents them in the same view, which helps explore the reasons why the GPU execution units were waiting. To use this event set, make sure to enable the multiple runs mode in the target properties.
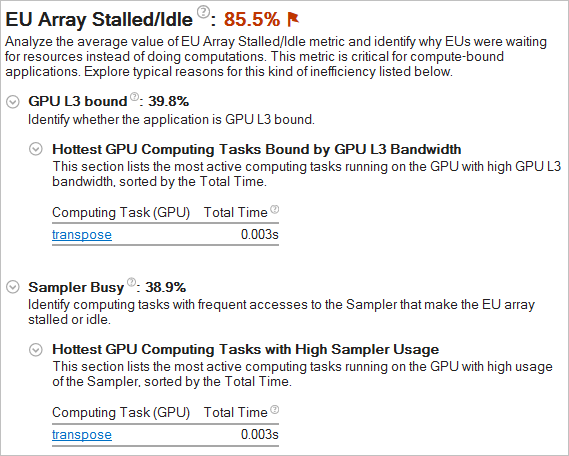
When the data is collected, explore the EU Array Stalled/Idle section of the Summary window to identify the most typical reasons why the execution units could be waiting.
Depending on the events preset you used for the configuration, the VTune Amplifier analyzes metrics for stalled/idle executions units. The GPU Hotspots analysis by default collects the Overview preset including the metrics that track general GPU memory accesses, such as Sampler Busy and Sampler Is Bottleneck, and GPU L3 bandwidth. As a result, the EU Array Stalled/Idle section displays the Sampler Busy section with a list of GPU computing tasks with frequent access to the Sampler and hottest GPU computing tasks bound by GPU L3 bandwidth:
If you select the Compute Basic preset during the analysis configuration, the VTune Amplifier analyzes metrics that distinguish accessing different types of data on a GPU and displays the Occupancy section that helps you identify GPU tasks with low occupancy:
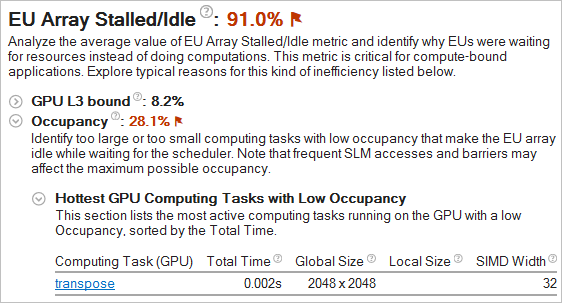
If the occupancy is flagged as a problem for your application, consider changing the size of computing tasks since too large or too small tasks typically make the EU array idle.
If you select the Full Compute (preview feature) preset and multiple run mode during the analysis configuration, the VTune Amplifier will use both Overview and Compute Basic event groups for data collection and provide all types of reasons for the EU array stalled/idle issues in the same view.
Note
To analyze Intel® HD Graphics and Intel® Iris™ Graphics hardware events on Linux targets, make sure to install the Intel Media Server Studio (starting with version 2015 R5) and build the kernel driver as described in the Intel Media Server Studio Getting Started Guide.
To analyze GPU performance data per HW metrics over time, open the Graphics window, and focus on the Timeline pane. List of GPU metrics displayed in the Graphics window depends on the hardware events preset selected during the analysis configuration.
The example below shows the Overview group of metrics collected for the GPU bound application:
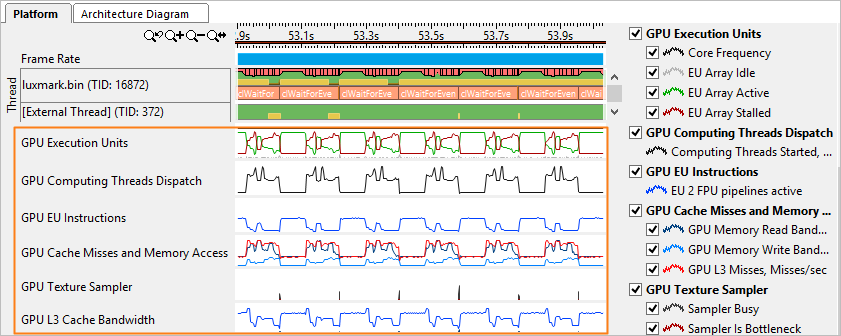
The first metric to look at is GPU Execution Units: EU Array Idle metric. Idle cycles are wasted cycles. No threads are scheduled and the EUs' precious computational resources are not being utilized. If EU Array Idle is zero, the GPU is reasonably loaded and all EUs have threads scheduled on them.
In most cases the optimization strategy is to minimize the EU Array Stalled metric and maximize the EU Array Active. The exception is memory bandwidth-bound algorithms and workloads where optimization should strive to achieve a memory bandwidth close to the peak for the specific platform (rather than maximize EU Array Active).
Memory accesses are the most frequent reason for stalls. The importance of memory layout and carefully designed memory accesses cannot be overestimated. If the EU Array Stalled metric value is non-zero and correlates with the GPU L3 Misses, and if the algorithm is not memory bandwidth-bound, you should try to optimize memory accesses and layout.
Sampler accesses are expensive and can easily cause stalls. Sampler accesses are measured by the Sampler Is Bottleneck and Sampler Busy metrics.
In the GPU Hotspots viewpoint, you may switch to the Platform tab and analyze how GPU metrics data correlates with CPU data, memory bandwidth, interrupts (if collected), and so on. You may select an area of interest on the timeline, right-click and select Filter In by Selection in the context menu to explore context-specific GPU metrics data in the Context Summary pane on the right:
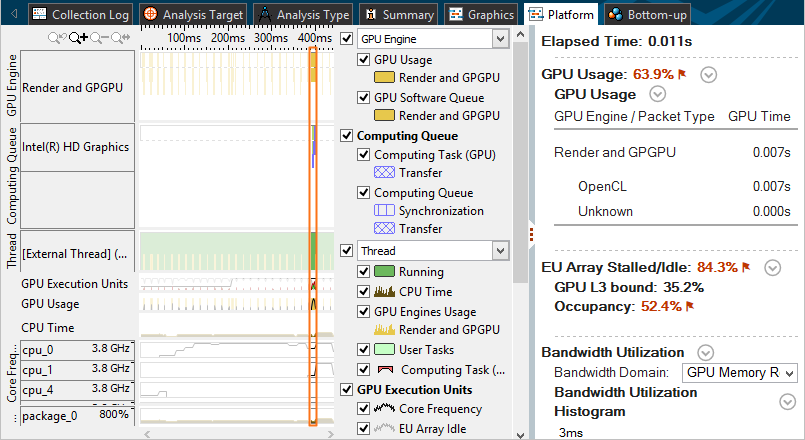
In this example, you see the statistics per GPU execution units used in the selected time range. The flagged value in red shows that a significant portion of the GPU time was spent idle due to low occupancy, which may be caused by inefficient work scheduling. The GPU Usage section shows the GPU Time per GPU engine and the percentage of the application Elapsed time when a GPU engine was utilized.
Explore Execution of OpenCL™ Kernels
If you know that your application uses OpenCL software technology and the GPU Computing Threads Dispatch metric in the Timeline pane of the Graphics window confirms that your application is doing substantial computation work on the GPU, you may continue your analysis and capture the timing (and other information) of OpenCL kernels running on Intel Graphics. To run this analysis, enable the Trace OpenCL and Intel Media SDK programs option during analysis configuration. GPU Hotspots analysis enables this option by default.
The Summary view shows OpenCL kernels running on the GPU in the Hottest GPU Computing Tasks section and flags the performance-critical kernels. Clicking such a kernel name opens the Graphics window grouped by Computing Task (GPU) / Instance. You may also want to group the data in the grid by the Computing Task. VTune Amplifier identifies the following computing task purposes: Compute (kernels), Transfer (OpenCL routines responsible for transferring data from the host to a GPU), and Synchronization (for example, clEnqueueBarrierWithWaitList).
The corresponding columns show the overall time a kernel ran on the GPU and the average time for a single invocation (corresponding to one call of clEnqueueNDRangeKernel ), working group sizes, as well as averaged GPU hardware metrics collected for a kernel. Hover over a metric column header to read the metric description and view the formula used for the metric calculation. If a metric value for a computing task exceeds a threshold set up by Intel architects for the metric, this value is highlighted in pink, which signals a performance issue. Hover over such a value to read the issue description.
Analyze and optimize hot kernels with the longest Total Time values first. These include kernels characterized by long average time values and kernels whose average time values are not long, but they are invoked more frequently than the others. Both groups deserve attention.
To view details on OpenCL kernels submission and analyze the time spent in the queue, explore the Computing Queue data in the Timeline pane of the Graphics or Platform window.
Explore Execution of Intel Media SDK Tasks (Linux* only)
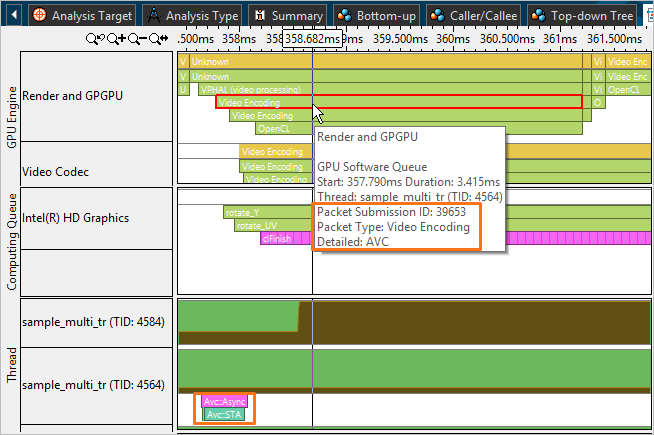
If you enabled both the Analyze GPU usage and Trace OpenCL and Intel Media SDK programs options for the Intel Media SDK program analysis, use the Graphics window to correlate data for the Intel Media SDK tasks execution with the GPU software queue data.
Switch to the Platform window and explore the GPU Engine area that shows a GPU software queue and GPU packet submission details for Intel Media SDK applications: