Use the Intel® VTune™ Amplifier's GPU analysis to monitor usage of GPU hardware resources, effective GPU time, OpenCL™ computing tasks and Intel Media SDK program tasks.
VTune Amplifier provides the following options to analyze how effectively your application uses an available graphics processor:
Option |
Overhead |
Supported Target System |
Supported Graphics |
Supported Analysis Type |
|---|---|---|---|---|
low |
All |
All |
CPU/GPU Concurrency (default), GPU Hotspots (default), custom analysis |
|
medium |
Windows, Linux and Android |
Intel HD Graphics and Intel Iris™ Graphics (further: Intel Graphics) only (root privileges required) |
CPU/GPU Concurrency (Overview preset), GPU Hotspots, custom analysis |
|
high |
OpenCL kernels analysis: Windows and Linux Intel Media SDK program analysis: Linux |
Intel Graphics only |
GPU Hotspots (default), custom analysis |
Prerequisites: For Linux* targets, to analyze Intel HD and Intel Iris Graphics (further: Intel Graphics) hardware events on a GPU, make sure to install the Intel Media Server Studio (starting with version 2015 R5) and build the kernel driver as described in the Getting Started Guide.
To enable GPU analysis options:
Click the
 New Analysis button on the VTune Amplifier toolbar.
The Analysis Type configuration window opens.
From the analysis tree on the left, choose an applicable analysis type, for example: GPU Hotspots.
The right pane is updated with the configuration options for the selected analysis type.
GPU Usage
Enable the Analyze GPU usage option to configure the VTune Amplifier to explore GPU busyness over time and understand whether your application is CPU or GPU bound.
When the data is collected, explore the Timeline pane: Platform tab in the Graphics window. Theoretically, if you see that the GPU is busy most of the time and having small idle gaps between busy intervals and the GPU software queue is rarely decreased to zero, your application is GPU bound. If the gaps between busy intervals are big and the CPU is busy during these gaps, your application is CPU bound. But such obvious situations are rare and you need a detailed analysis to understand all dependencies. For example, an application may be mistakenly considered GPU bound when GPU engines usage is serialized (for example, when GPU engines responsible for video processing and for rendering are loaded in turns). In this case, an ineffective scheduling on the GPU results from the application code running on the CPU.
When the GPU is intensely busy over time, you may look deeper and understand whether it is used effectively and whether there is some room for improvement. Such an analysis is possible with the hardware metrics collected by the VTune Amplifier for the Render and GPGPU engine of the Intel graphics.
Intel Graphics Render Engine and Hardware Metrics
A GPU is a highly parallel machine where graphical or computational work is done by an array of small cores, or execution units (EUs). Each EU simultaneously runs several lightweight threads. When one of these threads is picked up for an execution, it can hide stalls in the other threads if the other threads are stalled waiting for data from memory or other units.
To use the full potential of the GPU, applications should enable the scheduling of as many threads as possible and minimize idle cycles. Minimizing stalls is also very important for graphics and general purpose computing GPU applications.
VTune Amplifier provides an option to monitor Intel GPU hardware events and display metrics about integral GPU resource usage over a sampled period, for example, ratio of cycles when EUs were idle, stalled, or active as well as statistics on memory accesses and other functional units. If the VTune Amplifier traces GPU OpenCL kernels execution, it annotates each kernel with GPU metrics.
The scheme below displays metrics collected by the VTune Amplifier across different parts of the Intel Graphics:
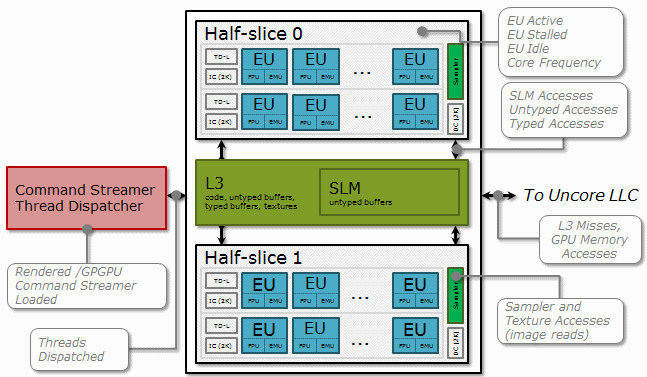
GPU metrics help identify how efficiently GPU hardware resources are used and whether any performance improvements are possible. Many metrics are represented as a ratio of cycles when the GPU functional unit(s) is in a specific state over all the cycles available for a sampling period. To see a formula used for a metric calculation, hover over a corresponding column name in the grid. For example, the VTune Amplifier collects data for the following basic GPU hardware metrics:
Metric |
Formula |
|---|---|
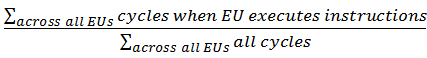
EU Array Active |
|
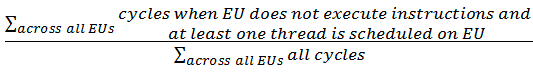
EU Array Stalled |
|
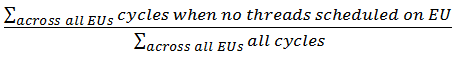
EU Array Idle |
|
For GPU metrics analysis with the VTune Amplifier, select the Analyze Processor Graphics hardware events option and choose a platform-specific preset of the hardware metrics from the drop-down menu. All presets collect data about execution units (EUs) activity: EU Array Active, EU Array Stalled, EU Array Idle, Computing Threads Started, and Core Frequency.
Overview event set also includes metrics that track general GPU memory accesses such as Memory Read/Write Bandwidth, GPU L3 Misses, Sampler Busy, Sampler Is Bottleneck, and GPU Memory Texture Read Bandwidth. These metrics can be useful for both graphics and compute-intensive applications.
Compute Basic (with global/local memory accesses) event group also includes metrics that distinguish accessing different types of data on a GPU: Untyped Memory Read/Write Bandwidth, Typed Memory Read/Write Transactions, SLM Read/Write Bandwidth, Render/GPGPU Command Streamer Loaded, and GPU EU Array Usage. These metrics are useful for compute-intensive workloads on the GPU.
Compute Extended event group includes metrics targeted only for GPU analysis on the Intel processor code name Broadwell and higher. For other systems, this preset is not available.
Full Compute (preview) event set combines the Overview and Compute Basic event groups, which enables detecting and representing EU Arrays Stalled/Idle issues within the same analysis result.
Use the GPU sampling interval option to specify an interval (in milliseconds) between GPU samples for GPU hardware metrics collection. By default, the VTune Amplifier uses 1ms interval for the hardware event-based sampling collection and 1000ms for the user-mode sampling and tracing collection.
When collection and post-processing is complete and the result is open, click the Graphics tab to see details of GPU activity, also correlated with CPU processes and threads. For GPU metrics description, hover over the column name in the grid or right-click and select the What's This Column? context menu option.
OpenCL™ Kernels and Intel Media SDK Programs Analysis
For GPU-bound applications using OpenCL software technology or Intel Media SDK applications, you may select the Launch Application or Attach to Processtarget configurations and enable the Trace OpenCL and Intel Media SDK programs analysis option.
For OpenCL applications, you may identify the hottest OpenCL kernels, explore the computing queue in the Graphics window that presents kernels submission to execution on the GPU, correlate this data with the hardware metrics, and identify the GPU architecture block where a performance issue for a particular kernel was detected.
Note
In the Attach mode if you attached to a process when the computing queue is already created, VTune Amplifier will not display data for the OpenCL kernels in this queue.
For Intel Media SDK programs, you may explore the Intel Media SDK tasks execution on the timeline and correlate this data with the GPU usage at each moment of time.