When you create a project for the Intel® VTune™ Amplifier performance analysis, you have to specify what you want to profile - your analysis target, which could be an executable file, a process, or a whole system.
Target Setup
Open the Analysis Target window using any of the following options:
Click the Create Project button in the Create a Project dialog box.
Click the
 Configure Project toolbar button or select the
Configure Project... option from the product menu.
Configure Project toolbar button or select the
Configure Project... option from the product menu.
Click the
 New Analysis toolbar button and click the
Choose Target button on the command toolbar on the
right.
New Analysis toolbar button and click the
Choose Target button on the command toolbar on the
right.
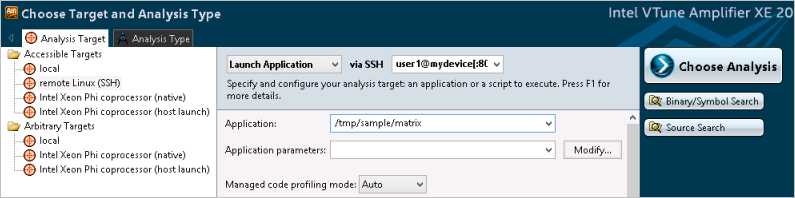
The result tab opens the Choose Target and Analysis Type window with the Analysis Target and Analysis Type tabs. The Analysis Target tab is active.
From the left pane, select a required group of analysis targets:
Accessible Targets: Select to configure and launch a target accessible from your current host either locally or via a remote connection. VTune Amplifier detects the specified target and connection, and provides a list of configuration options available for this target platform.
Arbitrary Targets: Create a command line configuration for a platform not accessible from the current host. You can select any of the supported hardware platforms and operating systems, configure corresponding target and analysis options, and generate a command line by clicking the Command Line button. The generated command line will be saved in the buffer and can be used later on the intended host.
Select a type of target system, which is a system where a profiling session runs:
local
Run an analysis on the local host system.
Note
This type of the target system is not available for macOS*.
remote Linux (SSH)
Run an analysis on a remote regular or embedded Linux* system. VTune Amplifier uses the SSH protocol to connect to your remote system.
Android device (ADB)
Run an analysis on an Android device. VTune Amplifier uses the Android Debug Bridge* (adb) to connect to your Android device.
Note
This system type is supported by the VTune Amplifier for Systems only.
Intel Xeon Phi coprocessor (native)
Run an analysis for a native Intel® Xeon Phi™ coprocessor application.
Note
This system type is supported by the VTune Amplifier XE only.
Intel Xeon Phi coprocessor (host launch)
Run an analysis on the Intel Xeon Phi coprocessor for an offload, mpirun or OpenCL™ application launched from the host and submitting work to the Intel Xeon Phi coprocessor.
Note
This system type is supported by the VTune Amplifier XE only.
The right pane is updated with the applicable configuration options.
From the right pane, select an analysis target type:
Launch Application
Enable the Launch Application pane and choose and configure an application to analyze, which can be either a binary file or a script.
Note
This target type is not supported for the Basic Hotspots analysis of Android applications. Use the Attach to Process or Launch Android Package types instead.
Attach to Process
Enable the Attach to Process pane and choose and configure a process to analyze.
Profile System
Enable the Profile System pane and configure the system-wide analysis that monitors all the software executing on your system.
Launch Android Package
Enable the Launch Android Package pane to specify the name of the Android* package to analyze and configure target options.
Note
This type of target is available only in the VTune Amplifier for Systems.
Each target type has particular configuration settings. By selecting the target type from the drop-down menu, you enable respective pane for editing the target configuration. For example, selecting the remote Linux (SSH) target system opens a configuration where you can specify your remote machine data (SSH connection details), select and configure an analysis target:
The following target configurations are available:
Note
For driverless event-based sampling data collection, VTune Amplifier supports local and remote Launch Application, Attach to Process and Profile System target types but their support fully depends on the Linux Perf profiling credentials specified in the /proc/sys/kernel/perf_event_paranoid file and managed by the administrator of your system using root credentials. For more information see the perf_event related configuration files topic at http://man7.org/linux/man-pages/man2/perf_event_open.2.html. By default, only user processes profiling at the both user and kernel spaces is permitted, so you need granting wider profiling credentials via the perf_event_paranoid file to employ the Profile System target type.
What's Next
Click the Choose Analysis button on the command toolbar to select an analysis type.
Optionally, click the Binary/Symbol Search and Source Search buttons on the command toolbar to configure search directories.
Click the Start button on the command toolbar to run the performance analysis.