Identify program units that took the most CPU time (hotspots) by using the Intel® VTune™ Amplifier's Hotspots viewpoint. This viewpoint is available for all analysis results.
To interpret the performance data provided in the Hotspots viewpoint, you may follow the steps below:
Define a Performance Baseline
Start with exploring the Summary window that provides general information on your application execution. Note that the Elapsed time, which includes application time from start to termination, differs from the application CPU time, which is a sum of the active (does not include waiting time) processor time for all the threads that run the application.
Use the Elapsed time value provided in the Summary window as a baseline for comparison of versions before and after optimization. Note that while tuning the application, the Elapsed time tends to decrease whereas the CPU time may increase with adding more threads to the application.
Identify the Hottest Function
The basic performance data is provided in the Bottom-up and Top-down Tree panes. Use this data to identify the hottest functions in your application.
By default, the data in the Bottom-up pane is sorted in the descending order providing the most time-consuming functions first. Focus on the functions with the largest CPU time. These are your candidates for optimization.
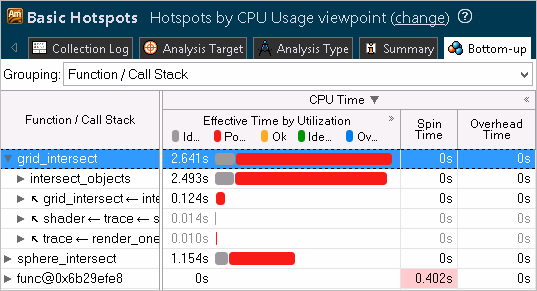
To get more details on how effectively the CPU time was used, switch to the Hotspots by CPU Usage viewpoint for the results of the user-mode sampling and tracing collection and expand the CPU Time column:

For the hardware event-based sampling results, you
do not need to switch to a different viewpoint.
CPU
utilization data is available when you expand the
Effective Time by Utilization column by clicking the
 symbol.
Focus your tuning efforts on the program units with
the largest
Poor value. This means that during the execution of these
program units your application underutilized the CPU time. The overall goal of
optimization is to achieve
Ideal (green
![]() ) or
OK (orange
) or
OK (orange
![]() ) CPU usage state and shorten
the Poor and Over CPU usage values.
) CPU usage state and shorten
the Poor and Over CPU usage values.
Identify Algorithm Issues
You can identify issues with the calling sequences in your application and improve performance by revising the way functions are called. The following methods to locate potential issues are available:
Top-down Tree pane: Analyze the Total and Self time data for callers and callees of the hotspot function to understand whether this time can be optimized.
Call Stack pane: Identify the highest contributing stack for the program unit(s) selected in the Bottom-up or Top-down Tree panes. Use the navigation buttons
 to see the different stacks that called the selected
program unit(s). The contribution bar shows the contribution of the currently
visible stack to the overall time spent by the selected program unit(s). You
can also use the drop-down list in the
Call Stack pane to view data for different types of stacks.
Analyze Source
Double-click the hottest function to view its related source code file in the Source/Assembly window. You can open the code editor directly from the Intel® VTune™ Amplifier and edit your code (for example, minimizing the number of calls to the hotspot function).
Explore Other Analysis Types
Use the Concurrency analysis to find where your application does not effectively use the available processor cores.
Run the comparison analysis to understand the performance gain you obtain after your optimization.
Run a microarchitecture analysis to identify hardware issues affecting the performance of your application.