Explore the Intel® VTune™ Amplifier General Exploration viewpoint for the PMU analysis based on the top-down microarchitecture analysis method that uses key hardware metrics organized by execution categories so that you could easily identify what portion of the pipeline is responsible for the majority of execution time.
When the General Exploration analysis type is complete, the VTune Amplifier opens the General Exploration viewpoint. The hierarchy of event-based metrics in this viewpoint depends on your hardware architecture. For example, starting with the Intel microarchitecture code name Ivy Bridge, the VTune Amplifier analyzes execution categories based on the Top-Down Microarchitecture Analysis Method:
The four leaf categories serve as high-level performance metrics in the General Exploration viewpoint.
Each metric is an event ratio defined by Intel architects and has its own predefined threshold. VTune Amplifier analyzes a ratio value for each aggregated program unit (for example, function). When this value exceeds the threshold and the program unit has more then 5% of CPU time from collection CPU time, it signals a potential performance problem and highlights such a value in pink.
Note
For a detailed tuning methodology behind the General Exploration analysis and some of the complexities associated with this analysis, see Understanding How General Exploration Works in Intel® VTune™ Amplifier.
For architecture-specific Tuning Guides, visit https://software.intel.com/en-us/articles/processor-specific-performance-analysis-papers.
To interpret the performance data provided during the hardware event-based sampling analysis, you may follow the steps below:
Learn Metrics and Define a Performance Baseline
In the General Exploration viewpoint, click the Summary tab to switch to the Summary window.
The first section displays the summary statistics on the overall
application execution per hardware-related metrics measured in
Pipeline Slots or
Clockticks. Metrics are organized by execution categories. To view a
metric description, mouse over the help icon
 :
:
In the example above, mousing over the L1 Bound metric displays the metric description in the tooltip.
A flagged metric value signals a performance issue for the whole application execution. Mouse over the flagged value to read the issue description:
You may use the performance issues identified by the VTune Amplifier as a baseline for comparison of versions before and after optimization. Your primary performance indicator is the Elapsed time value.
Grayed out metric values indicate that the data collected for this metric is unreliable. This may happen, for example, if the number of samples collected for PMU events is too low. In this case, when you hover over such an unreliable metric value, the VTune Amplifier displays a message:
You may either ignore this data, or rerun the collection with the data collection time, sampling interval, or workload increased.
All metric names are hyperlinks. Clicking such a hyperlink opens the Bottom-up window and sorts the data in the grid by the selected metric.
Identify Hardware Issues
To view hardware issues per a program unit, switch to the Bottom-up pane. Each row represents a program unit and percentage of time used by this unit. Program units that take more than 5% of the CPU time are considered as hotspots. By default, the VTune Amplifier sorts the data in the descending order by Clockticks and provides the hotspots at the top of the list.
Most of the columns in the Bottom-up pane represent a hardware performance metric. VTune Amplifier calculates a metric based on the formula provided by Intel architects. Mouse over the column header to read the metric description and view the formula. By default, metric values are represented as numbers. You can change the representation mode with the Show Data As context menu option.
Each metric has a threshold value. If the metric value exceeds the threshold and the program unit is a hotspot, the VTune Amplifier highlights this value in pink as performance-critical. Mouse over each pink cell to read a description of the issue, recommended solution (if any), and the formula used to calculate a threshold value for the issue.
In the example above, created on the Intel microarchitecture code name Skylake, the VTune Amplifier identified the price_out_impl function as the biggest hotspot that took the most CPU time. VTune Amplifier detected that the back-end portion of the pipeline caused the stalls. For the back-end, the VTune Amplifier identified Memory Bound > DRAM Bound issue as a dominant bottleneck. 44.9% of Clockticks used in the function price_out_impl was stalled waiting for the data from DRAM. This means that if you focus on this function hotspot and optimize it, you can potentially gain ~2x speed-up for this function.
VTune Amplifier is able to identify the most common types of pipeline bottlenecks. You may go deeper for more details. If the deeper levels of the metrics do not display any data, it means that the VTune Amplifier cannot see a dominant bottleneck on the lower level.
Analyze Source
When you identified a critical function, double-click it to open the Source/Assembly window and analyze the source code.
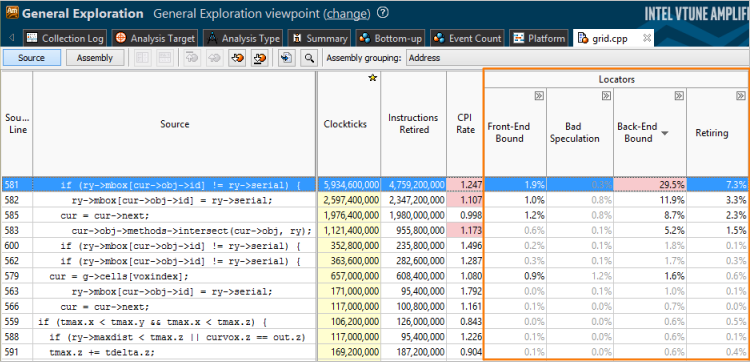
The Source/Assembly window displays locator metrics that show what code contributed the most to the issue represented by the metric. For example, if you have the Back-End Bound metric equal to 60% for your function, the source view for this function splits the 60% value across function source lines or instructions to help you identify a source line/instruction with the biggest value contributing the most to the total 60% Back-End Bound metric.
Use the hotspots navigation toolbar buttons to navigate to the biggest hotspot for each locator metric and identify the code to optimize.
Explore Other Analysis Types/Viewpoints
You may view the collected data using the Hotspots viewpoint or run the Basic Hotspots analysis type. Analyzing the source and assembly code for the hotspot function in the Hotspots viewpoint helps identify which instruction contributes most to the poor performance and how much CPU time the hotspot source line takes. Such a code analysis could be useful for the hotspots that do not show any issues in the sub-metrics but do show problems at the upper level of metrics (see the example above).
Run the comparison analysis to understand the performance gain you obtain after your optimization.
You may create your own analysis configuration and monitor events you are interested in.
Note
For information on processor events, see the Intel Processor Event Reference.