Intel® VTune™ Amplifier provides a set of hardware event-based analysis types that help you estimate how effectively your application uses hardware resources. These analysis types monitor hardware events supported by your system's Performance Monitoring Unit (PMU). The PMU is hardware built inside a processor to measure its performance parameters such as instruction cycles, cache hits, cache misses, branch misses and many others.
Note
You can explore raw event database available at https://download.01.org/perfmon.
For more information on Intel® 64 and IA-32 architectures, explore Intel Software Developer Manuals available at http://www.intel.com/content/www/us/en/processors/architectures-software-developer-manuals.html.
For details on hardware events supported by your system's PMU, use any of the following options:
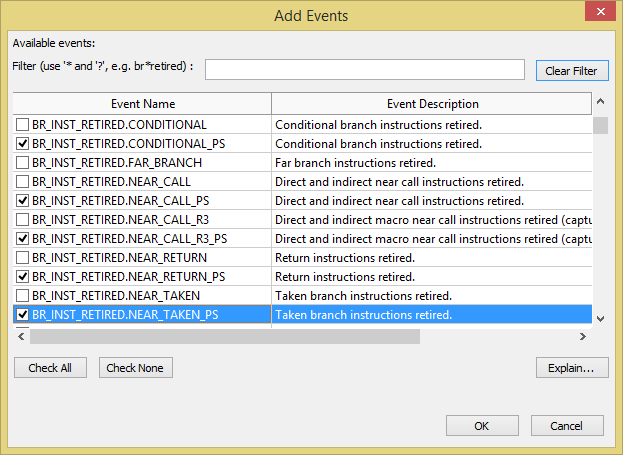
When adding new events to your custom configuration, select an event in the Add Events dialog box and explore its short description, or click the Explain button to open the Intel Processor Events Reference for more details:

For short descriptions of events used for a predefined hardware event-based sampling analysis type, use the Analysis Type window and explore the Events table > Event Description column.
In the Help Search tab, enter an event name and click Search. The Search tab displays a list of microarchitecture-specific topics containing this event data.
Intel Processor Event Reference provides an event database for the following Intel microarchitectures: