Intel® VTune™ Amplifier XE and Intel® VTune™ Amplifier for Systems Help

Hardware Event List

If required, edit a list of PMU events monitored by the Intel® VTune™ Amplifier for your processor by modifying an existing or creating a new hardware event-based sampling (EBS) analysis configuration.

To add events:

  1. Create a new hardware event-based sampling analysis type.

    The new analysis type shows up under the Custom Analysis node in the Analysis Type window.

  2. Select the newly created analysis type and click the Edit button on the right pane of the Analysis Type window.

    The Custom Analysis dialog box opens.

  3. In the Custom Analysis dialog box, click the Add Event button.

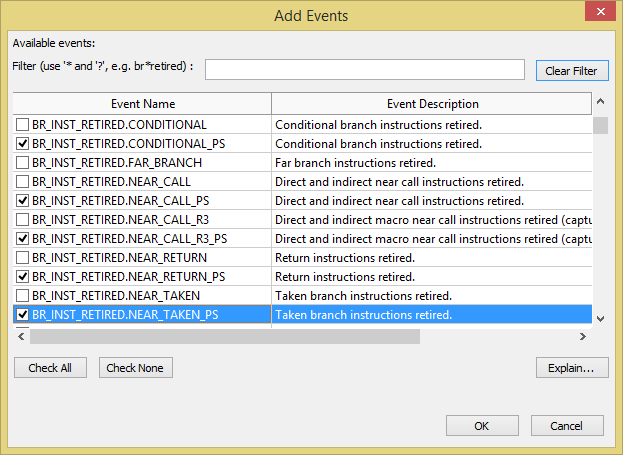
    The Add Events dialog box opens.

  4. From the list of events, select the events you want the VTune Amplifier to monitor in this configuration.

    You may select an event and click the Explain... button at the bottom to open the Intel Processor Event Reference and read more details on the selected event.

    To filter in/out the event list for particular event(s), specify search keywords (applied to both the Event Name and Event Description columns) in the Filter field.

    Note

    Usually precise events have a _PS postfix (for example, UOPS_RETIRED.RETIRE_SLOTS_PS) and/or a clear indication (Precise Event) in the Event Description column.

  5. Click OK to close the Add Events dialog box.

    The event list in the Custom Analysis dialog box is updated.

  6. Click OK to close the Custom Analysis dialog box.

    The new hardware event-based sampling analysis configuration is updated with the new events.

Note

You may configure the VTune Amplifier to monitor all the events in a single collection run using event multiplexing or allow multiple runs to collect more precise event data.
See Also