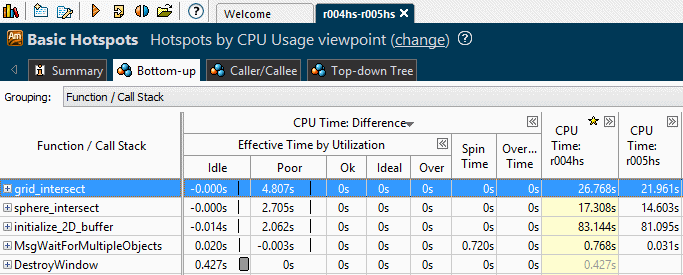
To view the difference before and after optimization for a function and its callers, click the Bottom-up sub-tab for the comparison result you created using the Compare Results window.
In the compare mode, the Bottom-up window shows the data columns of the two results and a new column showing the difference between the two results for each program unit. The difference is calculated as <Result 1 Value> - <Result 2 Value>.
Example: Comparison for Basic Hotspots Analysis Results
The Bottom-up window displays the data columns for each result and a Difference column that calculates the difference between the two results. By default, the Difference column is collapsed and displays the total difference data per CPU time. You may click the double-arrow icon to expand the column and see comparison data per utilization level.

CPU time specific difference is calculated as <Result 1 CPU time> - <Result 2 CPU time>, which is r004hs-r005hs (see the tab title). Expand the first two columns to see the data used for the calculation.

For the first grid_intersect function in this example, the difference is 26.768s - 21.961s = 4.807s of Poor CPU utilization time, which means that serial CPU time has reduced by 4.8s after optimization (Result 2). But the Ideal CPU time has not changed.