Intel® VTune™ Amplifier compares analysis results and displays difference in a separate result tab <result1>-<result2> in the following windows:
Summary window provides top-level difference for the analysis run.
Bottom-up window displays difference for functions and their callers per metric.
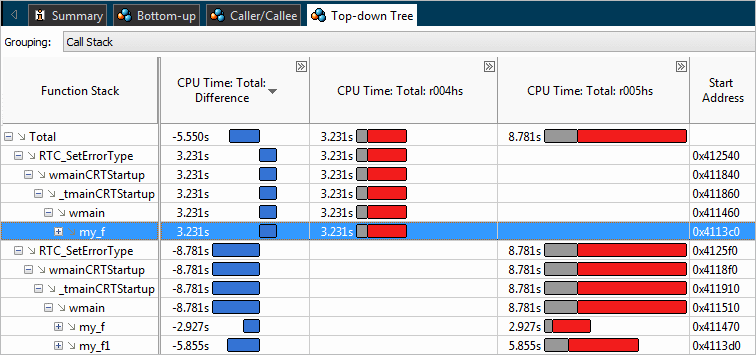
Top-down Tree window displays difference for functions and their callees per metric.
Caller/Callee window displays difference for a selected function, their callers and callees per metric.
Comparing Recompiled Binary Files
By default, the VTune Amplifier displays compared functions grouped by the Call Stack granularity, which is based on function instances. But you may want to switch to the Source Function Stack grouping to get more accurate comparison results in the following cases:
You slightly changed the source and recompiled the code.
You changed compilation options and recompiled the code.
You are comparing results compiled and collected for different Intel microarchitectures (for example, Sandy Bridge vs. Westmere analysis types)
For example, your binary with a my_f function was modified with adding a new function my_f1 and new calls of this function. As a result, my_f address has changed. If you compare the results before and after the modification using the default Call Stack grouping, the VTune Amplifier treats the same functions with different addresses as separate instances and does not compare them:

When the data is aggregated by Source Function Stack, the VTune Amplifier ignores start addresses and compares functions by source file objects:

Bar Data Respresentation
If you chose the Bar format to display the performance data in the Bottom-up or Top-down Tree window, the VTune Amplifier calculates the bar size as follows:
Result Data Column |
Difference Column |
|---|---|
cell_data_value/absolute_max_value_in_result_column |
cell_data_value/max(absolute_max_value_in__1st_result_column, absolute_max_value_in_corresponding_2nd_result_column) |
Example: Calculation of the Bar Size
The table below provides an example on how the VTune Amplifier calculates the bar size in the compare mode based on the absolute max CPU time value and performance data per column:
CPU Time:r001 |
CPU Time:r002 |
CPU Time:Difference |
|
|---|---|---|---|
Absolute max value (calculated by the VTune Amplifier internally but not exposed in the grid) |
10s |
20s |
20s |
Performance data |
1s |
3s |
2s |
Bar size |
1s/max(10s,20s) |
3s/max(10s,20s) |
2s/max(10s,20s) |