 You identified
initialize_2D_buffer as the hottest function. In the
Bottom-up pane, double-click this function to open the
Source window and analyze the source code:
You identified
initialize_2D_buffer as the hottest function. In the
Bottom-up pane, double-click this function to open the
Source window and analyze the source code:
Understand basic options provided in the Source window.
Understand Basic Source Window Options
The table below explains some of the features available in the Source window when viewing the Basic Hotspots analysis data.
|
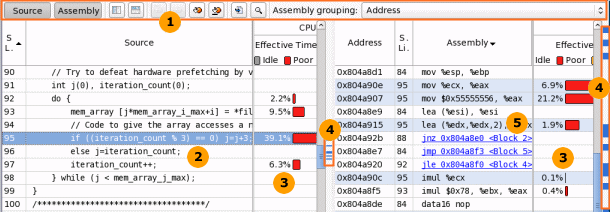
Source window toolbar. Use the hotspot navigation buttons to switch between most performance-critical code lines. Hotspot navigation is based on the metric column selected as a Data of Interest. For the Hotspots by CPU Usage viewpoint, this is CPU Time: Self. Use the Source/Assembly buttons to toggle the Source/Assembly panes (if both of them are available) on/off. |
|
Source pane displaying the source code of the application if the function symbol information is available. The hottest code line in the function is highlighted. The source code in the Source pane is not editable. If the function symbol information is not available, the Assembly pane opens displaying assembler instructions for the selected hotspot function. To enable the Source pane, make sure to build the target properly. |
|
Processor time attributed to a particular code line. If the hotspot is a system function, its time, by default, is attributed to the user function that called this system function. |
|
Heat map markers to quickly identify performance-critical code lines (hotspots). The bright blue markers indicate hot lines for the function you selected for analysis. Light blue markers indicate hot lines for other functions. Scroll to a marker to locate the hot code line it identifies. |
|
Assembly pane displaying the assembler instructions for the selected hotspot function. Assembler instructions are grouped by basic blocks. The assembler instructions for the selected hotspot function are highlighted. To get help on an assembler instruction, right-click the instruction and select Instruction Reference. NoteTo get the help on a particular instruction, make sure to have the Adobe* Acrobat Reader* 9 (or later) installed. If an earlier version of the Adobe Acrobat Reader is installed, the Instruction Reference opens but you need to locate the help on each instruction manually. |
Identify the Hottest Code Lines
When you identify a hotspot in the serial code, you can make some changes in the code to tune the algorithms and speed up that hotspot. Another option is to parallelize the sample code by adding threads to the application so that it performs well on multi-core processors. This tutorial focuses on algorithm tuning.
By default, when you double-click the hotspot in the
Bottom-up pane, VTune Amplifier opens the source file positioning at the most time-consuming code line of this function. For the
initialize_2D_buffer function, this is the line used to initialize a memory array using non-sequential memory locations. Click the
 Source Editor button on the
Source window toolbar to open the default code editor and work on optimizing the code.
Source Editor button on the
Source window toolbar to open the default code editor and work on optimizing the code.
Note
Depending on the sample code version, your source line numbers may slightly differ from the numbers provided in this tutorial.