Contents
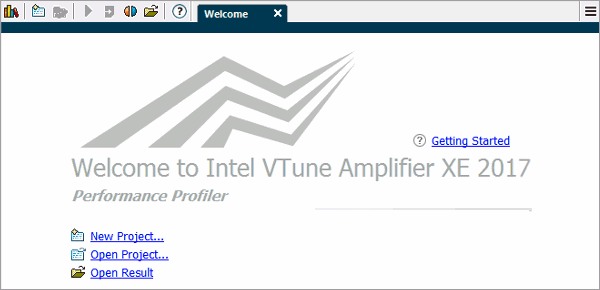
Step 1: Start the VTune Amplifier
Step 2: Set Up the Analysis Target
Intel® VTune™ Amplifier XE can be installed on Windows*, macOS*, and Linux* platforms and used for analysis of local and remote target systems. Use this tool to analyze the algorithm choices, find serial and parallel code bottlenecks, understand where and how your application can benefit from available hardware resources, and speed up the execution.
VTune Amplifier XE is available as a standalone product as well as part of the following suites:
PREVIEW: Intel Performance Snapshot gives you three quick ways to discover untapped performance:
Application Performance Snapshot: Estimate the potential performance impact of vectorization and threading for your application using key indicators for CPU, FPU, and memory utilization.
Storage Performance Snapshot: Review storage, CPU, memory, and network utilization to discover if faster storage will increase performance.
MPI Performance Snapshot: Assess optimization and tuning impact on cluster performance through calculations of MPI and OpenMP* imbalance, CPI rate and memory usage, MPI vs computation time, and FLOPS.
Visit the VTune Amplifier training page for videos, webinars, and more to help you get started.
For hardware event-based sampling analysis, make sure you have the sampling driver installed.
For remote analysis, set up your remote Linux target system.
For system requirements, see the product Release Notes.
Set up the environment variables:
csh/tcsh users: source <install_dir>/amplxe-vars.csh
bash users: source <install_dir>/amplxe-vars.sh
For root users: /opt/intel/vtune_amplifier_xe_2017
For non-root users: $HOME/intel/vtune_amplifier_xe_2017
For standalone GUI interface, run the amplxe-gui command.
For command line interface, run the amplxe-cl command.
Build your target application in the Release mode with all optimizations enabled.
Create a VTune Amplifier project:
In the Analysis Target tab, select a target system from the left pane and select an analysis target type from the right pane.
Configure your target: application location, parameters, and search directories (if required).
NEW: Select Arbitrary Targets to analyze a target that is not currently accessible from this host system. You can select a hardware platform and operating system from the list, create a command line analysis configuration, save it to the buffer, and run it later on the intended host. For more information, see Analysis Target Setup.
Switch to the Analysis Type tab.
From the left pane, select an analysis type applicable to your platform and configure analysis options in the right pane.
Click the Start button on the right to launch the analysis.
When data collection completes, the VTune Amplifier opens the result in the default viewpoint, which is a preset configuration of windows for an analysis result. You may switch between different viewpoint to analyze the data from different perspectives using different sets of performance metrics.
Start your analysis with the Summary window to get an overview of the application performance and then switch to other windows to explore the performance deeper at the granularity of function, source line and so on.
ALGORITHM ANALYSIS |
|
|---|---|
|
|
MICROARCHITECTURE ANALYSIS |
|
|
|
PLATFORM ANALYSIS |
|
|
|
COMPUTE-INTENSIVE APPLICATION ANALYSIS |
|
|
|
SOURCE ANALYSIS |
|
|
|
MANAGED CODE ANALYSIS |
|
|
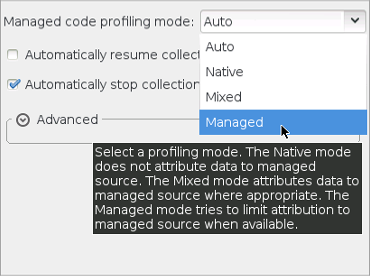
Configure target options for managed code analysis in the native, managed, or mixed mode:
|
|
CUSTOM ANALYSIS |
|
|
|
Document |
Description |
|---|---|
The online training site is an excellent resource for learning VTune Amplifier basics with Getting Started guides, videos, tutorials, webinars and technical articles. |
|
Tutorials show you how to use basic VTune Amplifier features. VTune Amplifier tutorials guide a new user through basic walkthrough operations with a short sample. The tutorials provide an excellent foundation before you read the VTune Amplifier help. The default installation location for the VTune Amplifier tutorials is <install-dir>/documentation/<locale>/tutorials. Sample code is typically installed to <install-dir>/samples/<locale>/<programming_language>. VTune Amplifier sample code and corresponding tutorials are also available at https://software.intel.com/en-us/product-code-samples |
|
The Release Notes document contains the most up-to-date information about the product, including a product description, technical support, and known limitations and issues. This document also contains system requirements for installing the product. Before installation, the Release Notes document is located at the root level (same level as the installation script/executable) of the installation download package. This document is installed at: <install-dir>/documentation/<locale>/release_notes_amplifier_linux.pdf |
|
The Installation Guide contains basic installation instructions for VTune Amplifier and post-installation configuration instructions for the various drivers and collectors. The latest Installation Guide can be found on the Intel® Developer Zone (Intel® DZ) website. |
|
The help is the primary documentation for the VTune Amplifier. To view VTune Amplifier help, do the following: |
|
This help provides reference information for Intel processor events used by the VTune Amplifier for hardware event-based sampling analysis. Most of this information is drawn from Intel processor information sources on the web. To access the Event Reference, choose Intel Processor Event Reference from the Help menu, or go to Intel VTune Amplifier XE 2017 Help > Reference > Intel Processor Events. |
|
Command Line Help |
You can access general help for VTune Amplifier command line interface by entering the following command line:
|
Web Resources |
|
Intel, the Intel logo, VTune and Xeon Phi are trademarks of Intel Corporation in the U.S. and/or other countries.
* Other names and brands may be claimed as the property of others.
Microsoft, Windows, and the Windows logo are trademarks, or registered trademarks of Microsoft Corporation in the United States and/or other countries.
OpenCL and the OpenCL logo are trademarks of Apple Inc. used by permission from Khronos.
© 2017 Intel Corporation
 menu button in the right
corner and go to
New > Project... .
menu button in the right
corner and go to
New > Project... .
 Help button on the toolbar.