After you launch the Intel® Advisor GUI environment and choose your target, you can begin the process of using the Intel Advisor tools to help you add parallelism into parts of your program.
To launch the Intel Advisor tools, use one of the following:
-
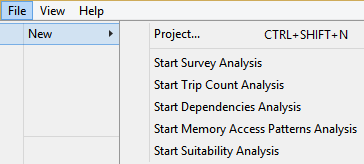
In the Intel Advisor GUI, click File >New and choose the desired action:
-
In the Intel Advisor toolbar, select the desired action by clicking the appropriate icon:
In the
Intel Advisor
GUI:

To display the installed help or the Getting Started
page, or view online videos or articles, click the
 icon on the
Intel Advisor
toolbar. The Getting Started page introduces the
Intel Advisor and provides links to the installed tutorials, documentation, and
online internet resources.
icon on the
Intel Advisor
toolbar. The Getting Started page introduces the
Intel Advisor and provides links to the installed tutorials, documentation, and
online internet resources.
The following table lists the actions available:
|
To Do This |
Use the Menu |
Use the Advisor Workflow Tab |
Use the Toolbars |
|---|---|---|---|
|
Run the Survey tool
|
In the product GUI, click File > New > Start Survey Analysis |
Below
Survey Target click the
|
Click
|
|
Run the Trip Counts tool
|
In the product GUI, click File > New > Start Trip Counts Analysis |
Below
Find Trip Counts click the
|
Click
|
|
Run the Suitability tool
|
In the product GUI, click File > New > Start Suitability Analysis |
In the
Threading Workflow tab below
Check Suitability click the
|
Click
|
|
Run the Dependencies tool
|
In the product GUI, click File > New > Start Dependencies Analysis |
Below
Check Dependencies click the
|
Click
|
|
Run the Memory Access Patterns tool
|
In the product GUI, click File > New > Start Memory Access Patterns Analysis |
In the
Vectorization Workflow below
Check Memory Access Patterns click the
|
Click
|
|
Create the data snapshot (read-only
version)
|
In the product GUI, find the
|
|
Click
|
|
Open the Project Properties dialog to view and modify project properties. |
In the product GUI, click File > Project Properties... |
|
Click
|
|
In the Intel Advisor product GUI, open or close the Project navigator |
In the product GUI, click View > Project Navigator |
|
Click
|
|
In the product GUI, create a new project. |
In the product GUI, click File > New > Project... |
|
Click
|
|
In the product GUI, open an existing project. |
In the product GUI, choose either:
|
|
Click the
|
|
Temporarily stop data collection while the target continues to run. |
|
Click the
|
|
|
Resume data collection that you previously paused or that was started as paused. |
|
Click the
|
|
|
Stop target execution and data collection, and display the result collected thus far. This button is enabled when the collection is in progress. |
|
Click the
|
|
|
Cancel the target execution and data collection. Discards the data collected so far. This button is enabled when the collection is in progress. |
|
Click the
|
|
|
Cancel data finalization. Retains the data collected. This button is enabled when data finalization is in progress. |
|
Click the
|
|
 with your application
(target) to profile it to locate hotspots.
with your application
(target) to profile it to locate hotspots.
 button or
 . Once you start the analysis, pause
 , stop
 , and
cancel
, and
cancel
 buttons appear.
 in the
Intel Advisor
toolbar.
in the
Intel Advisor
toolbar.
 with your application
(target) to collect loop iteration statistics.
with your application
(target) to collect loop iteration statistics.
 with your application to
predict its approximate parallel performance. Before running this tool, add
source annotations to define at least one parallel site and task(s) within each
site.
with your application to
predict its approximate parallel performance. Before running this tool, add
source annotations to define at least one parallel site and task(s) within each
site.
 in the
Intel Advisor
toolbar..
in the
Intel Advisor
toolbar..
 with your application to
predict its potential data sharing problems. Before running this tool, add
source annotations to define at least one parallel site and task(s) within each
site.
with your application to
predict its potential data sharing problems. Before running this tool, add
source annotations to define at least one parallel site and task(s) within each
site.
 in the
Intel Advisor
toolbar..
in the
Intel Advisor
toolbar..
 with your application
(target) to collect data on memory access strides.
with your application
(target) to collect data on memory access strides.
 of
the current project.
of
the current project.
 in the
Intel Advisor
toolbar.
in the
Intel Advisor
toolbar.
 in the
Intel Advisor
toolbar.
in the
Intel Advisor
toolbar.
 in the
Intel Advisor
toolbar.
in the
Intel Advisor
toolbar.
 button in
the
Intel Advisor
toolbar.
button in
the
Intel Advisor
toolbar.
 button in the workflow tab.
 button in the
Survey Report or
Suitability Report window's command
toolbar.
button in the
Survey Report or
Suitability Report window's command
toolbar.