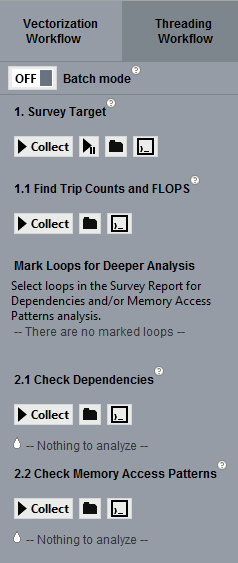
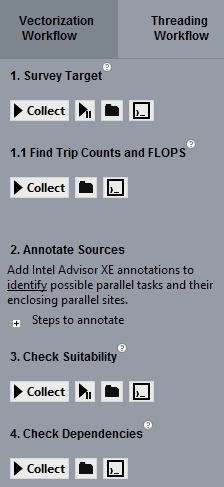
Like the Intel Advisor toolbar, the Advisor Workflow helps you launch Intel Advisor tools. In addition, it helps guide you through steps in the Intel Advisor workflow, and keeps track of your progress through the workflow. The workflow exists in two versions - Vectorization Workflow and Threading Workflow. Select between the workflows via the buttons at the bottom of the Workflow Tab.
|
Vectorization Workflow |
Threading Workflow |
|---|---|
|
|
|
You can hide and unhide the workflow tab via the
 and
and
 buttons
available in the middle of the separation line between the
Workflow Tab and the
Result Tab.
buttons
available in the middle of the separation line between the
Workflow Tab and the
Result Tab.
The following table summarizes use of the Advisor Workflow.
|
To Do This |
Use This |
|---|---|
|
Learn about each workflow step as you progress through the workflow. |
View the text below the step's name in the Advisor Workflow. The text includes relevant links to the Intel Advisor help. |
|
1. Survey Target -
Run the Survey tool
|
Below
Survey Target click the
|
|
1.1 Find Trip Counts
- Run the Trip Counts tool
|
Below
Find Trip Counts click the
|
|
2. Annotate Sources (Threading
Workflow only) - Add annotations
|
View instructions under
2. Annotate Sources and click the
|
|
2.2 Check Memory Access Patterns
(Vectorization Workflow only) tool
|
In the
Vectorization Workflow below
Check Memory Access Patterns click the
|
|
Mark Loops for Deeper Analysis
(Vectorization Workflow only) - Select loops
|
In the
Result Tab switch to the
Survey Report and in the
|
|
3. Check Suitability (Threading
Workflow only) - Run the Suitability tool
|
In the
Threading Workflow tab below
Check Suitability click the
|
|
4. or 2.1 Check
Dependencies - Run the Dependencies tool
|
Below
2.1 Check Dependencies in Vectorization
Workflow tab and
4. Check Dependencies in the Threading
Workflow tab, click the
|
|
Switch to the Threading Workflow Tab while the Vectorization Workflow Tab is active. |
Click the
|
|
Switch to the Vectorization Workflow Tab while the Threading Workflow Tab is active. |
Click the
|
 to profile your target
program to locate hotspots.
to profile your target
program to locate hotspots.
 button or
 . Once you start the analysis, pause
 , stop
 , and
cancel
, and
cancel
 buttons appear.
 to collect loop iteration
statistics.
to collect loop iteration
statistics.
 into your sources to mark
possible parallel regions.
into your sources to mark
possible parallel regions.
 button to
view the steps.
Use the
Survey Report and its
Survey Source window to help you locate
the code regions where you will add annotations.
To help you add
annotations and build settings, use the annotation assistant in the Survey
windows.
button to
view the steps.
Use the
Survey Report and its
Survey Source window to help you locate
the code regions where you will add annotations.
To help you add
annotations and build settings, use the annotation assistant in the Survey
windows.
 with your application
(target) to collect data on memory access strides.
with your application
(target) to collect data on memory access strides.
 columnt check-mark the
 loops
that you want to analyze with the Dependencies and\or Memory Access Patterns
tools as part of your Vectorization Workflow.
loops
that you want to analyze with the Dependencies and\or Memory Access Patterns
tools as part of your Vectorization Workflow.
 to predict approximate
performance improvements by sampling your program. This tool uses your inserted
annotations to predict site and task performance characteristics.
to predict approximate
performance improvements by sampling your program. This tool uses your inserted
annotations to predict site and task performance characteristics.
 to predict likely data
sharing problems before you add parallelism to your program. This tool uses
your inserted annotations to predict data sharing problems.
to predict likely data
sharing problems before you add parallelism to your program. This tool uses
your inserted annotations to predict data sharing problems.
 button.
 button.