To launch the Intel Advisor GUI, use the advixe-gui command after you set up your command line environment .
This topic contains the following sections:
- Open the Project Properties Dialog Box
- Specify Project Properties - Analysis Target Tab
- Specify Project Properties - Binary/Symbol Search Tab
- Specify Project Properties - Source Search Tab
Open the Project Properties Dialog Box
After you open a project, to display the Project Properties dialog box, do one of the following:
- Choose File > Project Properties...
- Click the
 icon on the
Intel Advisor toolbar.
icon on the
Intel Advisor toolbar.
After you display the Project Properties dialog box, the Analysis Target tab appears.
Specify Project Properties - Analysis Target Tab
To run your application for analysis, specify the location of the target executable as well as related information in this tab.
Use the Target type drop-down list to select whether the values in this tab apply to either:
- Survey and Suitability tools
- Dependencies tool
Because no optimization level is recommended for Dependencies tool but moderate optimization is recommended for the Survey and Suitability tools, you need to specify a different target for the Dependencies tool.
As shown below, the Analysis Target contains all available analysis types and multiple fields, beginning with the Application field:
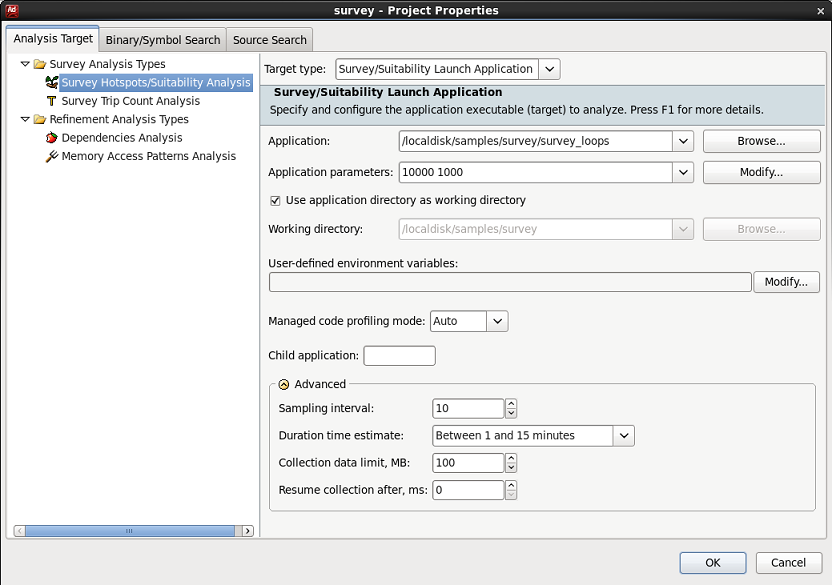
For the selected Analysis type, specify:
-
Target type:
- Select Launch Application to run the application right after you start any of the Intel Advisor tools.
- Select Attach To Process to collect data for an already running process. With this target type you can specify the target process name or PID if it is different from the properties that are specified for the application launch mode.
-
The Application (target): either type a path and file name to the target, or click the Browse... button and navigate to and select the application's target. You can specify a target executable or a script file. If you specify a script in the Application field, consider specifying the target executable to be analyzed in the Child application field; this is required for the Dependencies tool if a script is specified in the Application field.
-
The Application parameters: if your target's main entry point accepts command-line arguments, specify a value in this field. Either type a value, or click the Modify... button.
-
Use application directory as working directory: If checked, automatically uses the value in the Application directory as the value for the Working directory.
-
User-defined environment variables: Click Modify to specify the variable names and values.
-
Working directory: This is usually filled in from the project settings, but you can specify a different value. Either type a path, or click the Browse... button and navigate to and select a directory.
-
Managed code profiling mode: On Windows OS systems, choose the analysis mode to be used by the Intel Advisor. Auto mode automatically detects the type of target executable as Native or Managed, and switches to that mode. Native mode only collects data for native code and does not attribute data to managed code. Mixed mode collects data for both native and managed code, and attributes data to managed code as appropriate. Consider using this option when analyzing a native executable that makes calls to the managed code. Managed mode collects data for both native and managed code, resolves samples attributed to native code, attributes data to managed source only. The call stack in the analysis result displays data for managed code only.
-
Use the Child application field to limit the analysis done by Intel Advisor tools. When specifying properties for Dependencies tool analysis, if you specify a script file in the Application field, you must specify the target executable to be analyzed in the Child application field.
-
Certain Advanced values only apply to either the Survey Hotspots/Suitability Analysis or both Refinement Analysis Types:
-
Survey/Suitability: If your target executes in less than one minute or for multiple hours, specify the Duration time estimate. You can specify the Sampling Interval to control result size or specify a Collection Data Limit, such as for large results. You can specify the Resume collection after, ms value, which is like using Start Paused from the GUI. For details about these Advanced options, see Dialog Box Project Properties - Analysis Target.
-
Dependencies and\or Memory Access Patterns Analysis: You can specify the Suppression mode to choose either to show problems in system modules or suppress problems in system modules. For details, see Dialog Box Project Properties - Analysis Target.
-
Specify Project Properties - Binary/Symbol Search Tab
To enable Intel Advisor tool reports to display sources and provide binary-to-source correlation (debug) information, you must specify the location of binary and debug information symbol files associated with your application's source files in this tab. You must build your application with debug information (view the help topic Build Settings for your language - click the link under See Also below).
When using the advixe-cl command line, specify the project properties using the --search-dir option.
As shown below, the Binary/Symbol Search tab allows you to specify multiple locations to search for, such as a local directories or a symbol server URL.
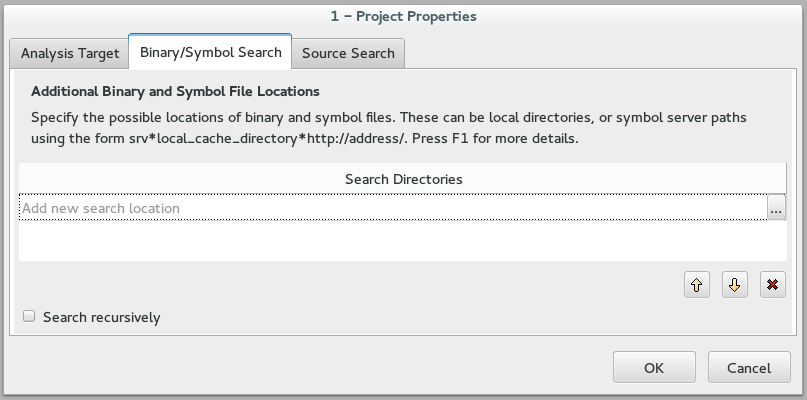
- Select a row containing Add new search location.
- Either click the
 button on the right of that row, or type directly into that row.
- If you clicked the
button, navigate (browse) to and select a directory.
- Click OK to add the row.
- Repeat the above steps if you need to include other locations. You can move the current row up, down, and delete rows using the buttons on the lower-right.
If you must search subdirectories of all specified directory locations, select the Search recursively check box (lower left corner). To use this recursive search, the rows must provide only a directory name and omit a file name. Using a recursive search for multiple directories may slow processing and could lead to unexpected results.
Specify Project Properties - Source Search Tab
To run your target with the Suitability and Dependencies tools, you must specify the location(s) of your application's annotated sources when using the Intel Advisor GUI. If you do not successfully provide the locations of the source files in this tab, Intel Advisor will not be able to locate your annotations and you will not be able to run the Suitability and Dependencies tools successfully.
When using the advixe-cl command line, specify the project properties using the --search-dir option.
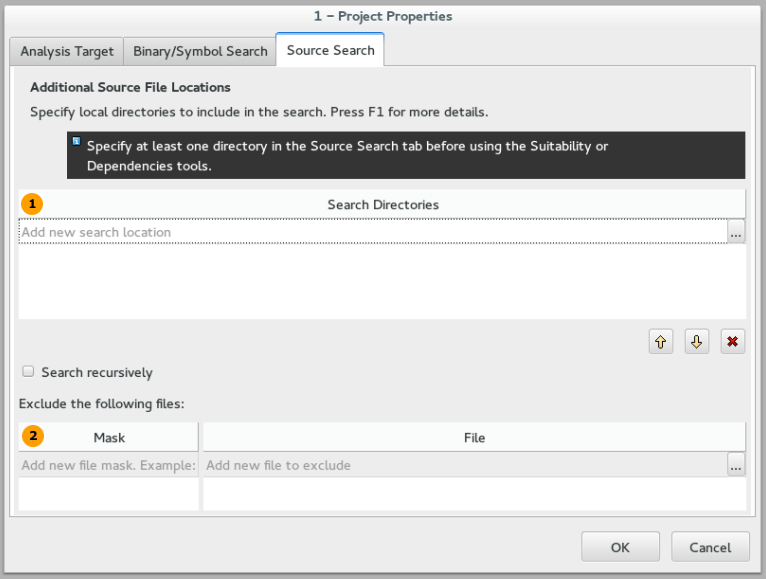
As shown below, the Source Search tab has two major areas:
- An upper area
 where you specify the location(s) of source files. You must specify at least one directory, including its path name. You can specify multiple directories. To indicate that
all
subdirectories be searched, select (check) the
Search recursively check box. To use recursive search, the lines must provide only a directory name and omit a file name. Using a recursive search for multiple directories may slow processing and could lead to unexpected results.
where you specify the location(s) of source files. You must specify at least one directory, including its path name. You can specify multiple directories. To indicate that
all
subdirectories be searched, select (check) the
Search recursively check box. To use recursive search, the lines must provide only a directory name and omit a file name. Using a recursive search for multiple directories may slow processing and could lead to unexpected results.
- A lower area
 to specify source file(s) to be excluded from the search, either a file name using wildcards (Mask column) or a specific file name (File column). For example, you might specify that a source control subdirectory be excluded.
Note
When using the Intel Advisor GUI, no source locations are automatically populated after you create a project, so you must specify one or more source locations so your application's annotations will be found.
To add a new row into the upper part of the tab, either type (or paste) a location into the row or:
- Select a row containing Add new search location.
- Either click the
button on the right of that row, or type directly into that row.
- If you clicked the
button, navigate (browse) to and select a directory.
- Click OK to add the row.
- Repeat the above steps if you need to include other locations. You can move the current row up, down, and delete rows using the buttons on the lower-right.
Similarly, to add rows into the lower (exclude from search) part of this tab, either type or click the
button to add wildcard file names under the
Mask column or specific file names under the
File column.
For information about the default source locations and the search order, see Binary/Symbol Search and Source Search Order and Locations.