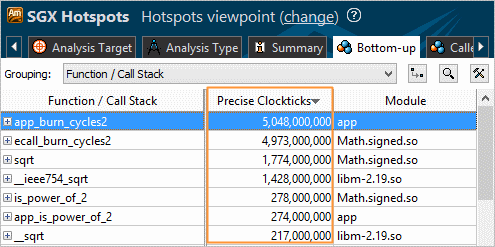
SGX Hotspots analysis type uses event-based sampling collection and is targeted for systems with Intel Software Guard Extensions (Intel SGX) feature enabled.
This analysis type uses the the INST_RETIRED.PREC_DIST hardware event that emulates precise clockticks and helps identify performance-critical program units inside security enclaves. Using the precise event is mandatory for the analysis on the systems with the Intel SGX enabled because regular non-precise events do not provide a correct instruction pointer and therefore cannot be attributed to correct modules.
To use the SGX Hotspots analysis type, explore:
Configuration options (knobs)
Configuration Options
To configure options for the TSX Hotspots analysis:
Click the
 New Analysis toolbar button.
The Analysis Type window opens.
From the left pane, select Microarchitecture Analysis > SGX Hotspots.
The SGX Hotspots configuration pane opens on the right.
Configure the following options:
CPU sampling interval, ms field
Specify an interval (in milliseconds) between CPU samples.
Possible values - 0.01-1000.
The default value is 1.
Analyze user tasks, events, and counters check box
Analyze the tasks, events, and counters specified in your code via the ITT API. This option causes a higher overhead and increases the result size.
The default value is false.
Details button
Expand/collapse a section listing the default non-editable settings used for this analysis type. If you want to modify these settings for the analysis, you need to create a custom configuration by right-clicking the analysis entry in the analysis tree and selecting Copy from Current from the context menu. VTune Amplifier creates an editable copy of this analysis type configuration and locates it under the Custom Analysis branch in the analysis tree.
Click Start to launch the analysis.
Viewpoints
You can choose to view SGX Hotspots analysis results in the Hotspots viewpoint that includes the following windows:
Summary window displays statistics on the overall application execution.
Bottom-up window displays performance data per CPU metrics (event ratio/event count/sample count) for each program unit.
Top-down Tree window displays hotspot functions in the call tree, performance metrics for a function only (Self value) and for a function and its children together (Total value).
Event Count window displays an estimated count of PMU events selected for the analysis.
Sample Count window displays the actual number of samples collected for a processor event.
Uncore Event Count window displays a count of uncore events selected for the analysis. If there are no uncore events, the upper pane of the window is empty.
Platform window provides details on tasks specified in your code with the Task API, Ftrace*/Systrace* event tasks, OpenCL™ API tasks, and so on. If corresponding platform metrics are collected, the Platform window displays overtime data as GPU usage on a software queue, CPU time usage, OpenCL™ kernels data, and GPU performance per the Overview group of GPU hardware metrics, Memory Bandwidth, and CPU Frequency
Analyze the Precise Clockticks metric values to identify the most time-consuming program units inside transactions.
