Note
Energy analysis with the Intel® SoC Watch data collector is available for target Android*, Windows*, or Linux* devices and provided only with the Intel® VTune™ Amplifier for Systems.
After you collect Intel® Energy Profiler data on your target system, using the Intel SoC Watch collector, you can import the import a *.sww1 (for Windows* OS) /*.pwr (for Android* or Linux* OS) results file to your host system with Intel VTune™ Amplifier for Systems installed, and view Platform Power analysis data.
Viewing Component Rows in the Timeline Pane
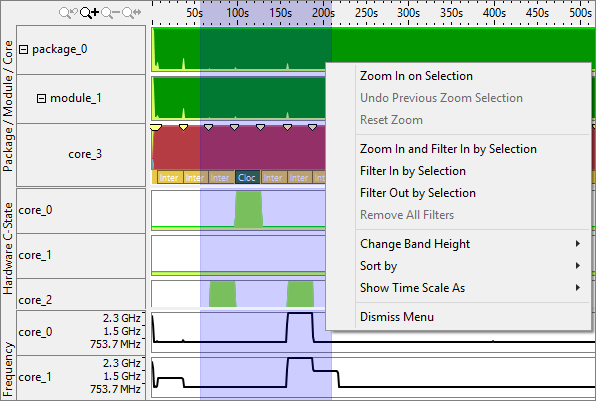
Some rows can expand and reveal component rows. Look for a + next to the row name, as in the Package C-state timeline shown below.

Zoom in on a Specific Section in the Timeline
Click and drag horizontally across the rows to select a time interval
within the total collection. Release the mouse button to see a list of options
for zooming in on this interval.
Zoom In and Filter In by Selection is particularly useful
because it will not only zoom, but also recalculate all of the grid’s summary
data based on the current selection. Once a filter has been applied in one tab
it will persist across all tabs within that viewpoint, highlighting the
selected time interval on each tab. Right-click and select
Remove All Filters to restore the original grid and clear the
selection from the timeline.