OpenMP is a fork-join parallel model, which starts with an OpenMP program running with a single master serial-code thread. When a parallel region is encountered, that thread forks into multiple threads, which then execute the parallel region. At the end of the parallel region, the threads join at a barrier, and then the master thread continues executing serial code. It is possible to write an OpenMP program more like an MPI program, where the master thread immediately forks to a parallel region and constructs such as barrier and single are used for work coordination. But it is far more common for an OpenMP program to consist of a sequence of parallel regions interspersed with serial code.
Ideally, parallelized applications have working threads doing useful work from the beginning to the end of execution, utilizing 100% of available CPU core processing time. In real life, useful CPU utilization is likely to be less when working threads are waiting, either actively spinning (for performance, expecting to have a short wait) or waiting passively, not consuming CPU. There are several major reasons why working threads wait, not doing useful work:
Execution of serial portions (outside of any parallel region): When the master thread is executing a serial region, the worker threads are in the OpenMP runtime waiting for the next parallel region.
Load imbalance: When a thread finishes its part of workload in a parallel region, it waits at a barrier for the other threads to finish.
Not enough parallel work: The number of loop iterations is less than the number of working threads so several threads from the team are waiting at the barrier not doing useful work at all.
Synchronization on locks: When synchronization objects are used inside a parallel region, threads can wait on a lock release, contending with other threads for a shared resource.
VTune Amplifier together with Intel Composer XE 2013 Update 2 or higher help you understand how an application utilizes available CPUs and identify causes of CPU underutilization.
To analyze an OpenMP appilcation with the VTune Amplifier, do the following:
Compile Your Code with Recommended Options
To enable parallel regions and source analysis during compilation, do the following:
To analyze OpenMP parallel regions, make sure to compile and run your code with the Intel® Compiler 13.1 Update 2 or higher (part of the Intel Composer XE 2013 Update 2). If an obsolete version of the OpenMP runtime libraries is detected, VTune Amplifier provides a warning message. In this case the collection results may be incomplete.
To access the newest OpenMP analysis options described in the documentation, make sure you always use the latest version of the Intel compiler.
To analyze an OpenMP application compiled with GCC*, make sure the GCC OpenMP library (libgomp.so) contains symbol information. To verify, search for libgomp.so and use the nm command to check symbols, for example:
$ nm libgomp.so.1.0.0If the library does not contain any symbols, either install/compile a new library with symbols or Debug Information for Application Binaries for the library. For example, on Fedora* you can install GCC debug information from the yum repository:
$ yum install gcc-debuginfo.x86_64
Configure OpenMP Analysis
To enable OpenMP analysis for your target:
Click the
 New Analysis button on the VTune Amplifier toolbar.
The Analysis Type configuration window opens.
From the left pane, choose an analysis type supporting OpenMP analysis: Basic Hotspots, Advanced Hotspots, Concurrency, HPC Performance Characterization, General Exploration, Memory Access, or any Custom Analysis type.
The right pane is updated with the configuration options for the selected analysis type.
Select the Analyze OpenMP regions option.
Note
HPC Performance Characterization Analysis analysis has this option enabled by default.
The OpenMP runtime library in the Intel Composer provides special markers for applications running under profiling that can be used by the VTune Amplifier to decipher the statistics of OpenMP parallel regions and distinguish serial parts of the application code.
You can run the OpenMP region analysis on both the host and the Intel Xeon Phi™ coprocessor.
Explore Application-Level OpenMP Metrics
Start your analysis with understanding the CPU utilization of your analysis target. If you are using the HPC Performance Characterization viewpoint, focus on the CPU Utilization section of the Summary window that shows the number of used logical CPUs and estimates the efficiency (in percent) of this CPU utilization. Poor CPU utilization is flagged as a performance issue.
Other viewpoints provide the CPU Usage Histogram that displays the Elapsed time of your application, broken down by CPU utilization levels. The histogram shows only useful utilization so the CPU cycles that were spent by the application burning CPU in spin loops (active wait) are not counted. You can adjust sliders from the default levels if you intentionally use a number of OpenMP working threads less than the number of available hardware threads.
If the bars are close to Ideal utilization, you might need to look deeper, at algorithm or microarchitecture tuning opportunities, to find performance improvements. If not, explore the OpenMP Analysis section of the Summary window for inefficiencies in parallelization of the application:
This section of the Summary window shows the Collection Time as well as the duration of serial (outside of any parallel region) and parallel portions of the program. If the serial portion is significant, consider options to minimize serial execution, either by introducing more parallelism or by doing algorithm or microarchitecture tuning for sections that seem unavoidably serial. For high thread-count machines, serial sections have a severe negative impact on potential scaling (Amdahl's Law) and should be minimized as much as possible.
Use the OpenMP Region Duration histogram in the Summary window to analyze instances of an OpenMP region, explore the time distribution of instance durations and identify Fast/Good/Slow region instances. Initial distribution of region instances by Fast/Good/Slow categories is done as a ratio of 20/40/20 between min and max region time values. Adjust the thresholds as needed.
Use this data for further detailed analysis in the grid views with OpenMP Region/OpenMP Region Duration Type/... grouping levels.
Identify Serial Code
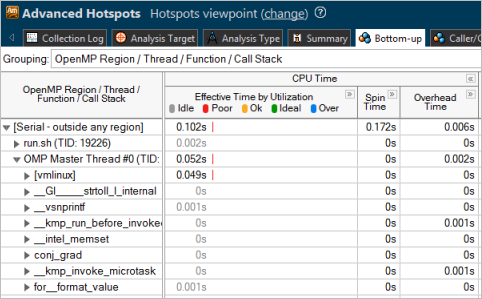
To analyze the serially executed code, switch to the Bottom-up window, select the /OpenMP Region/Thread/Function grouping, filter the view by the OMP Master Thread of the [Serial - outside any region] row and click the Effective Time by Utilization column header to sort the data by CPU time utilization:
Estimate Potential Gain
To estimate the efficiency of CPU utilization in the parallel part of the code, use the Potential Gain metric. This metric estimates the difference in the Elapsed time between the actual measurement and an idealized execution of parallel regions, assuming perfectly balanced threads and zero overhead of the OpenMP runtime on work arrangement. Use this data to understand the maximum time that you may save by improving parallel execution.
The Summary window provides a detailed table listing the top five parallel regions with the highest Potential Gain metric values. For each parallel region defined by the pragma #omp parallel, this metric is a sum of potential gains of all instances of the parallel region.
If Potential Gain for a region is significant, you can go deeper and select the link on a region name to navigate to the Bottom-up window employing the /OpenMP Region/OpenMP Barrier-to-Barrier Segment/.. dominant grouping that provides detailed analysis of inefficiency metrics like Imbalance by barriers.
Intel OpenMP runtime from Intel Parallel Studio instruments barriers for the VTune Amplifier. VTune Amplifier introduces a notion of barrier-to-barrier OpenMP region segment that spans from a region fork point or previous barrier to the barrier that defines the segment.
In the example above, there are four barrier-to-barrier segments defined as a user barrier, implicit single barrier, implicit omp for loop barrier and region join barrier.
For the cases when an OpenMP region contains multiple barriers either implicit with parallel loops or #pragma single sections, or explicit with user barriers, analyze the impact of a particular construct or a barrier to inefficiency metrics.
A barrier type is embedded to the segment name, for example: loop, single, reduction, and others. It also emits additional information for parallel loops with implicit barriers like loop scheduling, chunk size and min/max/average of the loop iteration counts that is useful to understand imbalance or scheduling overhead nature. The loop iteration count information is also helpful to identify problems with underutilization of worker threads with small number of iterations that can be a result of outer loop parallelization. Consider inner loop parallelization or "collapse" clause to saturate the working threads in this case.

Analyze the Potential Gain column data that shows a breakdown of Potential Gain in the region by representing the cost (in elapsed time) of the inefficiencies with a normalization by the number of OpenMP threads. Elapsed time cost helps decide whether you need to invest into addressing a particular type of inefficiency. VTune Amplifier can recognize the following types of inefficiencies:
Imbalance: threads are finishing their work in different time and waiting on a barrier. If imbalance time is significant, try dynamic type of scheduling. Intel OpenMP runtime library from Intel Parallel Studio Composer Edition reports precise imbalance numbers and the metrics do not depend on statistical accuracy as other inefficiencies that are calculated based on sampling.
Lock Contention: threads are waiting on contended locks or "ordered" parallel loops. If the time of lock contention is significant, try to avoid synchronization inside a parallel construct with reduction operations, thread local storage usage, or less costly atomic operations for synchronization.
Creation: overhead on a parallel work arrangement. If the time for parallel work arrangement is significant, try to make parallelism more coarse-grain by moving parallel regions to an outer loop.
Scheduling: OpenMP runtime scheduler overhead on a parallel work assignment for working threads. If scheduling time is significant, which often happens for dynamic types of scheduling, you can use a "dynamic" schedule with a bigger chunk size or "guided" type of schedule.
Atomics: OpenMP runtime overhead on performing atomic operations.
Reduction: time spent on reduction operations.
Tasking: time spent allocating and completing tasks. If the time is significant, consider increasing task granularity to reduce overhead.
If the Potential Gain column is not expandable for earlier versions of Intel OpenMP runtime, analyze the corresponding CPU Time metric breakdown.
To analyze the source of a performance-critical OpenMP parallel region, double-click the region identifier in the grid, sorted by the OpenMP Region/.. grouping level. VTune Amplifier opens the source view at the beginning of the selected OpenMP region in the pseudo function created by the Intel compiler.
Note
By default, the Intel compiler does not add a source file name to region names, so the unknown string shows up in the OpenMP parallel region name. To get the source file name in the region name, use the -parallel-source-info=2 option during compilation.
Analyze Metrics for Hybrid OpenMP-MPI Applications
For MPI analysis result including more than one process with OpenMP regions, the Summary window shows a section with top processes laying on a critical path of MPI execution with Serial Time and OpenMP Potential Gain aggregated per process:
Clicking the process name links leads you to the Bottom-up window grouped by /Process/OpenMP Region/.. where you can get more details on OpenMP inefficiencies for MPI ranks.
To explore an impact from multiple synchronization objects inside a region (for example, #pragma omp critical), use the Locks and Waits predefined analysis type. The Locks and Waits analysis is based on synchronization object function tracing, so big contention on synchronization objects can cause significant runtime overhead because of the analysis. Try to avoid synchronization inside regions using OpenMP reduction or thread local storage where possible.
Limitations
VTune Amplifier supports the analysis of parallel OpenMP regions with the following limitations:
Maximum number of supported lexical parallel regions is 512, which means that no region annotations will be emitted for regions whose scope is reached after 512 other parallel regions are encountered.
Regions from nested parallelism are not supported. Only top-level items emit regions.
VTune Amplifier does not support static linkage of OpenMP libraries.
Optimization Notice |
|---|
Intel's compilers may or may not optimize to the same degree for non-Intel microprocessors for optimizations that are not unique to Intel microprocessors. These optimizations include SSE2, SSE3, and SSSE3 instruction sets and other optimizations. Intel does not guarantee the availability, functionality, or effectiveness of any optimization on microprocessors not manufactured by Intel. Microprocessor-dependent optimizations in this product are intended for use with Intel microprocessors. Certain optimizations not specific to Intel microarchitecture are reserved for Intel microprocessors. Please refer to the applicable product User and Reference Guides for more information regarding the specific instruction sets covered by this notice. Notice revision #20110804 |