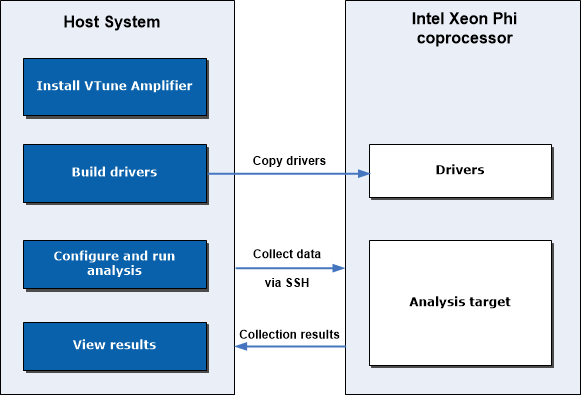
1.
|
Prepare your coprocessor
system for analysis
|
Install
the sampling server and driver
on an Intel Xeon Phi coprocessor card to be
sampled.
For native application analysis, copy the binary to the
Intel Xeon Phi coprocessor. For offload applications, no copying is required.
To communicate with the Intel Xeon Phi coprocessor cards,
you may use any of the following mechanisms:
Mount an NFS share. See the
NFS Mounting a Host Export topic in the Intel
Manycore Platform Software Stack (MPSS) help for details.
Use existing SSH tools. Make sure to
configure SSH to work
in a password-less mode.
|
3.
|
Specify and configure your analysis target from the host
system
|
In the
Analysis Target window,
select a target system and specify target options:
For proper symbol resolution,
specify search paths
for Intel Xeon Phi coprocessor modules in the
Binary/Symbol Search and
Source Search dialog boxes. Symbol resolution for
Intel Xeon Phi coprocessor modules is done on the host during collection
post-processing. You can also specify search paths after collection, but, if
you do that, the result should be re-resolved to get the symbol information
from the binaries after the symbol paths have been established.
|
4.
|
Configure and run an analysis type
|
From the performance analysis tree in the
Analysis Type window, choose and configure an
analysis type. If you selected an
Intel Xeon Phi coprocessor (native) or
Intel Xeon Phi coprocessor (host launch)
target system in the
Analysis Target window, the VTune Amplifier updates
the analysis tree in the
Analysis Type window to display the analysis types
supported for the Intel Xeon Phi coprocessor:
Note For Intel Xeon Phi coprocessor codenamed Knights Corner,
the call stack data collection is supported only for the
Intel Xeon Phi Coprocessor (native) target type.
Click
Start to run the analysis.
|
5.
|
Open and interpret analysis
results
|
Intel® VTune™ Amplifier
generates a data collection result and, by default, opens it in the default
viewpoint. Switch between available viewpoints to identify code regions that
took most of the CPU time and experienced potentially significant architectural
bottlenecks.
|
