If you had collected data on an application taking less than a second to run on an Intel® architecture host processor and then tried the same workload on the attached Intel Xeon Phi™ coprocessor, the performance statistics could be distorted. For example, on the host using a recent Intel Xeon® architecture, the sample result for General Exploration analysis looks like this:

But trying the same workload on one of the attached coprocessors reveals a seriously deteriorated view:

Cause
General Exploration analysis on different microarchitectures collects different events. To collect many events within a single run, the VTune Amplifier utilizes event multiplexing, where the analyzer periodically changes which events are being collected. If an application does the same things long enough so that the same activities could be sampled using all the events of interest, the VTune Amplifier can generate a complete picture of the application's performance. But if the application runs for such a short duration that there is not enough workload to collect all the events of interest, the results can be misleading. Due to the design decision to maximize core efficiency in the current generation of the Intel Xeon Phi coprocessors, each coprocessor thread only has two PMRs (performance monitoring registers) and it takes 7 runs of an application for the VTune Amplifier to collect all the events needed for its General Exploration analysis. When multiplexing events, the analyzer changes which events are collected every 30 milliseconds or so, which makes it over 200 ms of gap between subsequent collections of any particular pair. Looking at the VTune Amplifier timeline, or using the time command on the coprocessor, you can determine the runtime of a test application at around 1 second. Within this one-second run, each pair of events may only get collected through 4 sections out of 34 (34 x 30 ms = 1 sec or so there is only a limited number of slots).
Solution
To improve data quality, you can either increase the sampling rate, or disable event multiplexing at all. For this, In the Advanced section of the Analysis Target tab configure the following options:

Duration time estimate option: Modify to make the VTune Amplifier adjust a multiplier for the Sample After Value (SAV) used for regulating event-based sampling on the Intel processors. By default, the duration estimate is set to Between 1 and 15 minutes. To set up the duration from command line, use the -target-duration-type=short option.
Allow multiple runs (or -allow-multiple-runs) option: Select to turn off multiplexing between multiple sets of events. This option requires an ability to rerun the application. Setting this checkbox and counting the number of times the application announced itself in stdout helped identify that the General Exploration analysis on the Intel Xeon Phi coprocessor requires 7 sets of PMU settings to sample all the events over the entire duration of the application (you can also see the repeated runs in the VTune Amplifier Timeline pane). As long as the application executes the same way each time, there is a chance that the correlation between events collected on separate runs will be close enough to reality to be useful.
Example
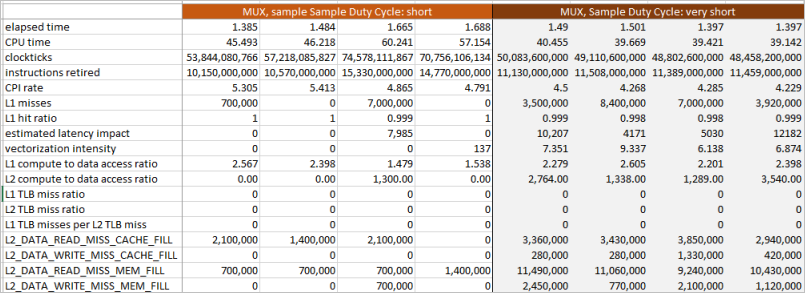
Examples below show how the quality of the data improves when you both vary between the two shortest sampling intervals and turn off the event multiplexing (MUX):

This is a summary of 4 runs with each one using event multiplexing to collect General Exploration events. The runs on the left use the default "short" interval and runs on the right use a "very short" interval. You see that the shorter sampling interval increases the chances of seeing data, but some of the statistics could be unreliable: estimated latency impact requires four events to compute, at least two separate multiplexer combinations that may not even have been collected in adjacent blocks of execution. So, while reducing the sampling interval at least produced something other than zeroes, this data may be still unreliable.
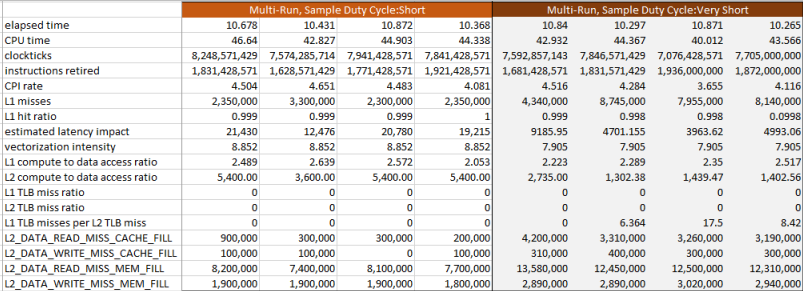
Turning off the event multiplexing increases data volume by executing multiple runs, collecting event samples spanning the entire run rather than brief intervals across it:

You can see that even choosing the "short" sampling interval, more fields in the summary are non-zero than in the MUX-instrumented runs. But even here you see the effects of the sampling interval: there is no much difference with the Clockticks and Instructions Retired count since these high frequency events do not suffer as much from the longer sampling interval and their values, as well as the CPI rate that is derived from them, are indistinguishable by eye. But this is not true for the cache miss events, for both L1 and L2_DATA. You see that the event counts on the right are significantly larger than those on the left, which looks like under-sampling. The improved sampling was enough to bring the latency impact estimates down by a factor of 4, though they still seem too high to be believable.
For the four variants for collection above, the multi-run collection with the "very short" sampling interval seems to produce the best data. If you need to analyze such a small workload, consider avoiding the default settings and select the tightest resolution you can to avoid as much as possible the chance of aliasing in your data collection.
Generally, if you plan to tune the performance of your application on the Intel Xeon Phi coprocessor, make sure your workload is big enough and parallel enough to be measurable on the platform where the work is divided between 240 or more hardware threads.