Use the Intel® VTune™ Amplifier viewpoints to analyze how long your application threads run in parallel and how effectively your application utilizes available CPU cores.
The following viewpoints are available:
Hotspots by CPU Usage viewpoint (default) to identify program units that took the most CPU time and understand how effectively the CPU time was used
Hotspots by Thread Concurrency viewpoint to understand how well logical threads of your application were able to be scheduled on the system CPUs
To interpret the performance data provided in these viewpoints, you may follow the steps below:
Define a Performance Baseline
Start with analyzing the application-level data provided in the Summary window for this analysis result. Use the Elapsed time as your primary indicator and a baseline for comparison of results before and after optimization.
Explore the CPU Usage and Thread Concurrency histograms that represent the Elapsed time and utilization level for the specified number of running threads and available CPUs. Ideally, your longest bars should be within the Ok or Ideal utilization range defined by the Intel® VTune™ Amplifier.
Identify Functions with Poor Concurrency and Poor CPU Usage
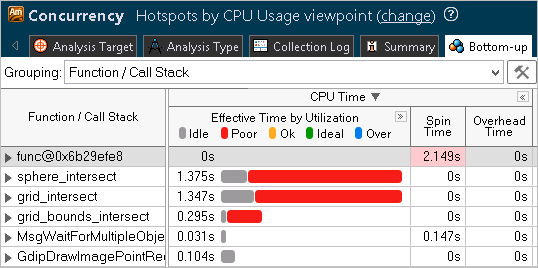
To identify functions that do not use available processor time effectively, explore the Bottom-up window .
To identify functions with poor CPU usage, explore
the
Hotspots by CPU Usage viewpoint. By default, the functions are
sorted by
Poor
processor utilization type. The most critical functions are provided first. You
can view the time distribution per processor utilization type by clicking the
![]() button at the
Effective Time by Utilization
column header to expand the column.
button at the
Effective Time by Utilization
column header to expand the column.
To identify functions that ran serially and did not use available cores effectively (functions with poor concurrency), switch to the Hotspots by Thread Concurrency viewpoint. The functions are sorted by CPU time with poor concurrency level. The usage mode is similar to the Hotspots by CPU Usage viewpoint.
You should focus your optimization efforts on
functions with the longest poor CPU time (red
![]() bars
if the bar format is selected). Next search for the longest over-utilized time
(blue
bars
if the bar format is selected). Next search for the longest over-utilized time
(blue
![]() bars).
bars).
The overall goal of optimization is to achieve
Ideal (green
![]() ) or
OK (orange
) or
OK (orange
![]() )
utilization and shorten the Poor and Over CPU utilization/concurrency.
)
utilization and shorten the Poor and Over CPU utilization/concurrency.
VTune Amplifier also measures the Overhead time and Spin time. If any of these metrics exceed the threshold set up by Intel architects for your processor type, the VTune Amplifier highlights these values in pink in the Bottom-up/Top-down Tree windows. Hover over the highlighted cell to get performance tuning advice.
Analyze the Timeline
The Timeline pane at the bottom of the Bottom-up/Top-down Tree windows shows the thread behavior in your application and how CPU Usage and Thread Concurrency metrics are changing over time. Analyze the data, select the problem area, and zoom in to selection using the context menu options. VTune Amplifier calculates the overall CPU Usage metric as the sum of CPU time per each thread of the Threads area. Maximum CPU Usage value is equal to [number of processor cores] x 100%. In the example below, CPU Time for a 12-core system is 100%, which means that the CPUs were not effectively utilized during this time range.
To understand what your application was doing during a particular time frame, select this range on the timeline, right-click and choose Zoom In and Filter In by Selection. VTune Amplifier will display functions executed during this time range. Identify functions with high CPU time (hotspots) and double-click a hotspot to identify the code lines that caused the issue.
Identify Algorithm Issues
You can identify issues with the call sequences in your application and improve performance by revising the way functions are called. The following methods to locate potential issues are available:
Top-down Tree pane: Analyze the Total and Self time data for callers and callees of the hotspot function to understand whether this time can be optimized.
Call Stack pane: Identify the highest contributing stack for the program unit(s) selected in the Bottom-up or Top-down Tree panes. Use the navigation buttons
 to see the different stacks that called the selected
program unit(s). The contribution bar shows the contribution of the currently
visible stack to the overall time spent by the selected program unit(s). You
can also use the drop-down list in the
Call Stack pane to view data for different types of stacks.
to see the different stacks that called the selected
program unit(s). The contribution bar shows the contribution of the currently
visible stack to the overall time spent by the selected program unit(s). You
can also use the drop-down list in the
Call Stack pane to view data for different types of stacks.
Analyze Source
When you identified a critical function, double-click it to open the Source/Assembly window and analyze the source code. From the Timeline pane, you can double-click the transition line to open the call site for this transition. You can open the code editor directly from the VTune Amplifier and edit your code (for example, adding parallelism, rebalancing or reducing contention).
Explore Other Analysis Types
Use the Locks and Waits analysis to understand possible reasons why your application does not use the available processor effectively.
Run the comparison analysis to understand the performance gain you obtain after your optimization.
Run an microarchitecture event-based sampling analysis to identify hardware issues affecting the performance of your application.