Use the Intel® VTune™ Amplifier's Locks and Waits viewpoint to identify causes of the poor CPU time utilization such as inefficient synchronization.
To interpret the locks and waits data, you may follow the steps below:
Define a Performance Baseline
Start with analyzing the application-level data provided in the Summary window for this analysis result. Use the Elapsed time value as a baseline for comparison of results before and after optimization.
Explore the CPU Usage and Thread Concurrency histograms that represent the Elapsed time and utilization level for the specified number of running threads and available CPUs. Ideally, your longest bars should be within the Ok or Ideal utilization range defined by the Intel® VTune™ Amplifier.
If you click one of the top waiting objects listed in the Summary, the VTune Amplifier will open the Bottom-up window with this object highlighted.
Identify Locks and Waits in Your Application
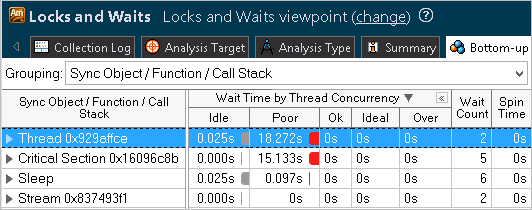
Explore the Bottom-up window to identify the most performance critical synchronization objects. Although it varies, often there are non-interesting threads waiting for a long time on objects infrequently. Usually you are recommended to focus your tuning efforts on the waits with both high Wait Time and Wait Count values, especially if they have poor utilization/concurrency.
By default, the synchronization objects are sorted
by Wait time. The most critical synchronization objects are displayed first.
You can view the time distribution per concurrency level by clicking the
![]() button at the
Wait Time by Thread Concurrency column header to expand the
column.
button at the
Wait Time by Thread Concurrency column header to expand the
column.

You should try to eliminate or minimize the Wait Time for the synchronization objects with the highest Wait Time (or longest red bars, if the bar format is selected) and Wait Count values.
VTune Amplifier also detects the Wait time spent in the synchronization construct while CPU is active (Spin time). If the Spin time exceeds the threshold set up by Intel architects for your processor type, the VTune Amplifier highlights these values in pink in the grid views or flags them in the Summary window. For example:

Use this metric to discover which synchronization objects are spinning. Consider adjusting Spin Wait parameters, changing the lock implementation (for example, by backing off then de-scheduling), or adjusting the synchronization granularity.
Analyze the Timeline
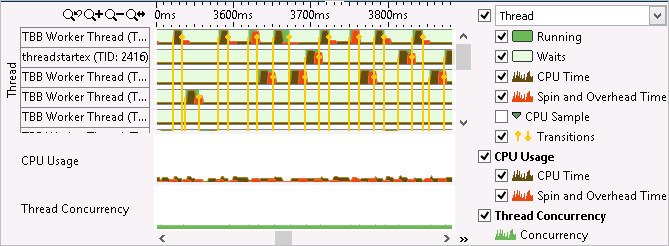
The Timeline pane at the bottom of the Bottom-up/Top-down Tree windows shows the thread behavior in your application and how CPU Usage, GPU Usage and Thread Concurrency metrics are changing over time.
The time during which the applications threads were actively running shows up as a dark-green band on the timeline. The time threads were spending waiting for a particular object shows up as in light-green. Hover over a band to see information on a wait object.
To analyze the data, select the problem area and zoom in to selection using the context menu options. For example, in the figure below the concurrency level is poor and a big number of transitions cause a lot of waits. You may double-click the transition line, switch to the source view, and analyze the code for this particular area. To understand what your application was doing during each wait, select the Zoom In and Filter In by Selection context menu option for a range of your interest in the timeline, and the VTune Amplifier will filter in the related objects in the Bottom-up grid. The Call Stack pane is also automatically updated to show a call stack of the selected type for a function where this wait occurred.

Identify Algorithm Issues
You can identify issues with the call sequences in your application and improve performance by revising the way functions are called. The following methods to locate potential issues are available:
Top-down Tree pane: Analyze the Total and Self time data for callers and callees of the hotspot function to understand whether this time can be optimized.
Call Stack pane: Identify the highest contributing stack for the synchronization object(s) selected in the Bottom-up or Top-down Tree panes. Use the navigation buttons
 to see the different stacks that called the selected
synchronization object(s). The contribution bar shows the contribution of the
currently visible stack to the overall time spent by the selected
synchronization object(s). You can also use the drop-down list in the
Call Stack pane to view data for different types of stacks.
Analyze Source
Double-click the hottest synchronization object (with the highest Wait Time and Wait Count values) to view its related source code file in the Source/Assembly window. From the Timeline pane, you can double-click the transition line to open the call site for this transition. You can open the code editor directly from the VTune Amplifier and edit your code.
Explore Other Analysis Types
Run the comparison analysis to understand the performance gain you obtain after your optimization.
Run an advanced event-based sampling analysis to identify hardware issues affecting the performance of your application.